As per the given chart it seems that the correction is complete as the 5 Wave leg down seems to be very precise.
Also note the red zone that I have drawn represents the most probable support zone for the fall and the market has taken support just above it.
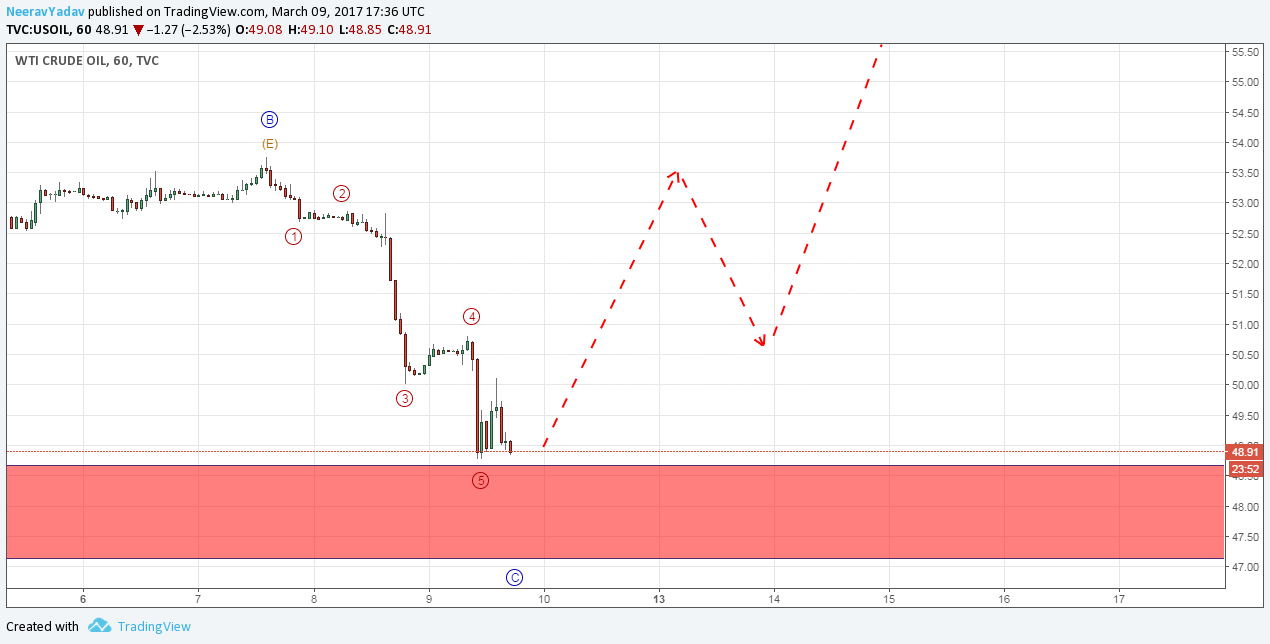
Crude Oul Elliott Wave Analysis and forecast 9th March 2017 onwards
It is possible that the 5 th Wave of this Wave C correction might take it a little lower, in that case the boundary of this Red box should offer the support.
Important support zone 48.70 to 47. (Red box)
In all likely cases Crude Oil is a buy on dips market.
I will update further as the market progresses.
Learn to trade using Elliott Wave Principles – My Video Course
To receive these updates at the earliest you can subscribe to my Emailing List.
Disclaimer – All content presented here is strictly for educational purpose, do read the complete site disclaimer before taking any action.