After completing Wave 3, it seems that Crude Oil is stuck in a sideways movement as of now which looks most likely as a Triangle.
A break above 48.35 or 49.93 would say that things are otherwise.
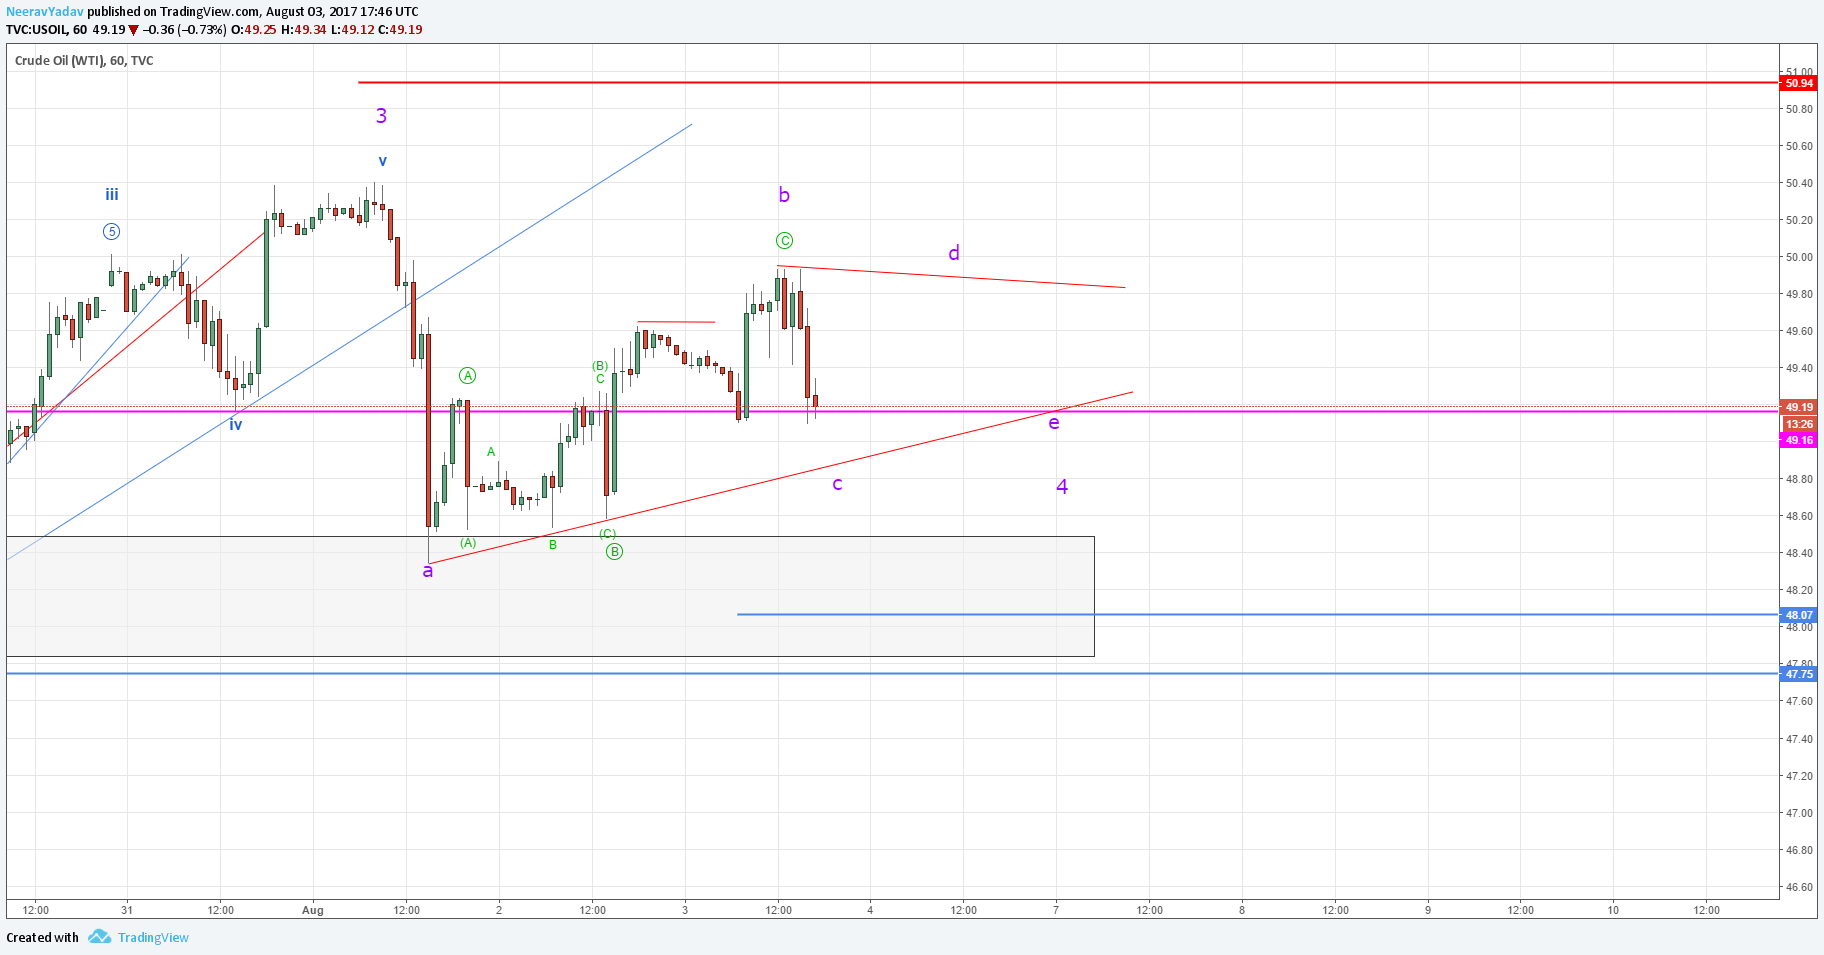
Possible Triangle in Crude Oil, 3rd August 2017 onwards (Elliott Wave Analysis)
Overall I expect one leg up after the completion of this pattern for Wave 5.
I will update further as this market progresses.
Get 1 month free entry to the private group and learn to trade using Elliott Wave Principles – My Video Course
To receive these updates at the earliest you can subscribe to my Emailing List.
Disclaimer – All content presented here is strictly for educational purpose, do read the complete site disclaimer before taking any action.