As I discussed in the last video report SPX has broken above 2500+ , as of now there are both a bullish as well as a bearish count that this market can play out.
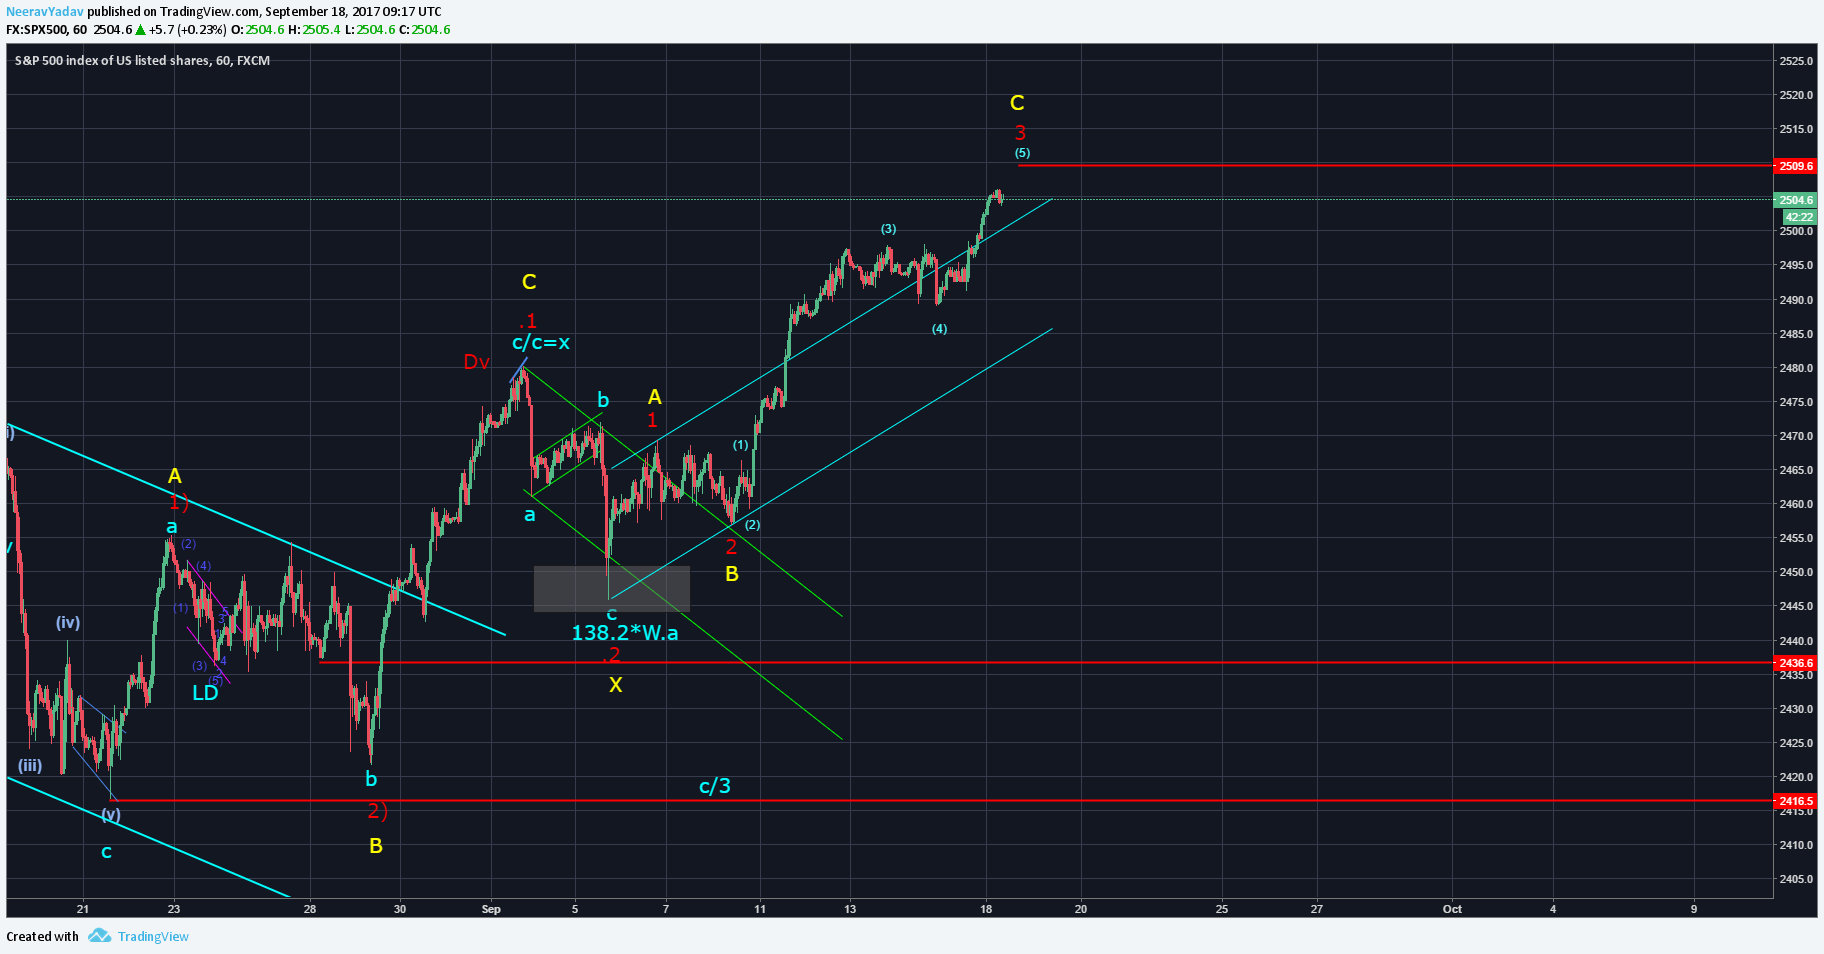
At first let’s look at the bullish count in Red which shows a 1)-2) -1-2-.1-.2 upside formation.
As per this count we have big upside left and SPX should see 2540 + levels after giving a small correction around 2509, hence as per this count we will wait to see the correction near the 2509 level and if we see a break above 2509 after the correction then we will initiate longs for higher targets.
SPX at crucial level (Elliott Wave Analysis)
Now let’s take a look at the bearish count in Yellow, which basically shows a Double Zig Zag structure that will have Wave W = Wave Y near the 2509 level.
In short both the bullish and the bearish count specify that we are about to see a correction near the 2509 level and hence this correction will determine the direction of the market from there on, if the correction is Impulsive then it might be the start of the new leg down and if the correction is simple 3 legs down not too deep then that will give us clue that more upside is still to be see.
Untill then the only trades that can be initiated are scalps for the small upside target of 2509.
As always I do update this market and number of other markets on regular intraday basis in my private group, if you wish to learn more from such updates and how I trade with Elliott Waves then you can find the details here : learn to trade using Elliott Wave Principles – My Video Course
To receive these updates at the earliest you can subscribe to my Emailing List.
Disclaimer – All content presented here is strictly for educational purpose, do read the complete site disclaimer before taking any action.