In my last video report I discussed the 2 possibilities or the Wave counts that can take place.
The last article suggested that either the Wave 2 in Gold was completed at 1240 and it has started the Wave 3 and is in Wave 2 of Wave 3.
The second probability was that it was in a Flat correction.
Situation Now :
Gold has attained the first suggested target that is 1247, breached it and seems to be treating 1247 – 1250 region as resistance, this suggests to me that the Wave is progressing as a Wave C and only once it goes a little below 1240 can we think of the Flat pattern getting completed.
Target 1 : 1240
Target 2: 1226
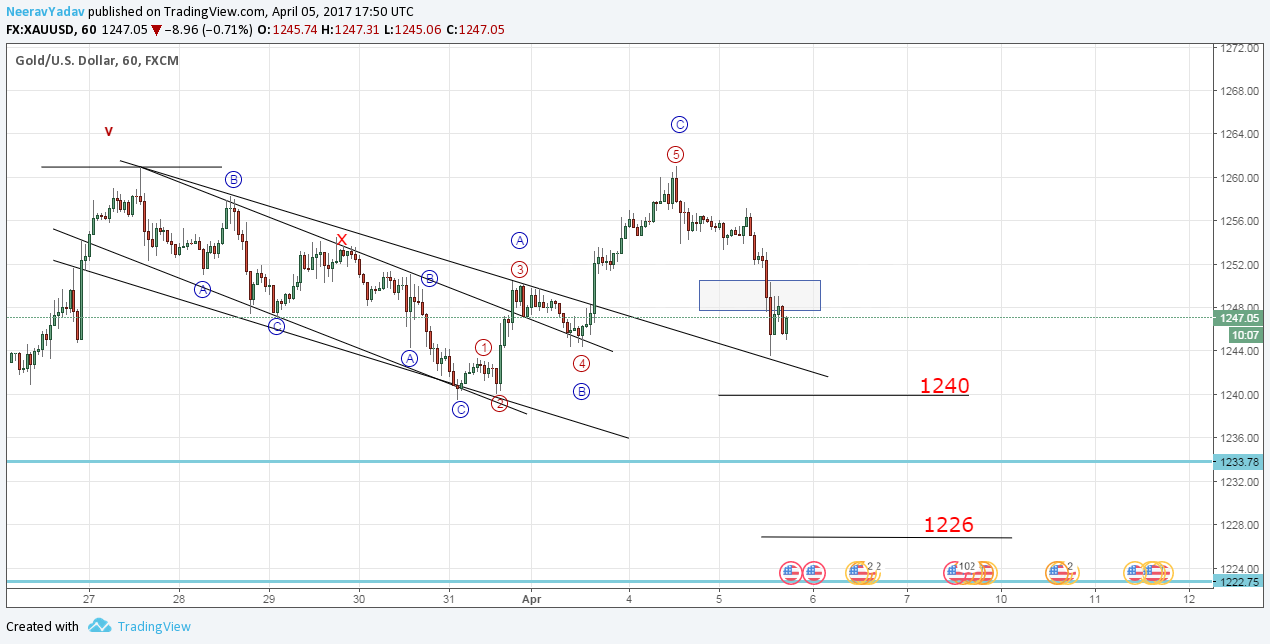
Gold moving down as expected (Elliott Wave Analysis) follow up 5th April 2017
Note : If the market moves above the boxed zone and takes it as support then the probabilities would suggest long side trades.
I will update further as this market progresses.
Learn to trade using Elliott Wave Principles – My Video Course
To receive these updates at the earliest you can subscribe to my Emailing List.
Disclaimer – All content presented here is strictly for educational purpose, do read the complete site disclaimer before taking any action.