After completing a double Zig Zag type of correction (discussed in my previous post) Gold now seems to be going up in an impulse, however the currently it seems to be in Wave 2 which looks like a Zig Zag indicating that prices can head lower from 12000 to 1175 region.
This is the main count as of now and the leg one seems to be a Leading Diagonal, other counts exist like Gold following a 1-2, 1-2 kind of Wave structure but the most fitting count is what I have presented here.
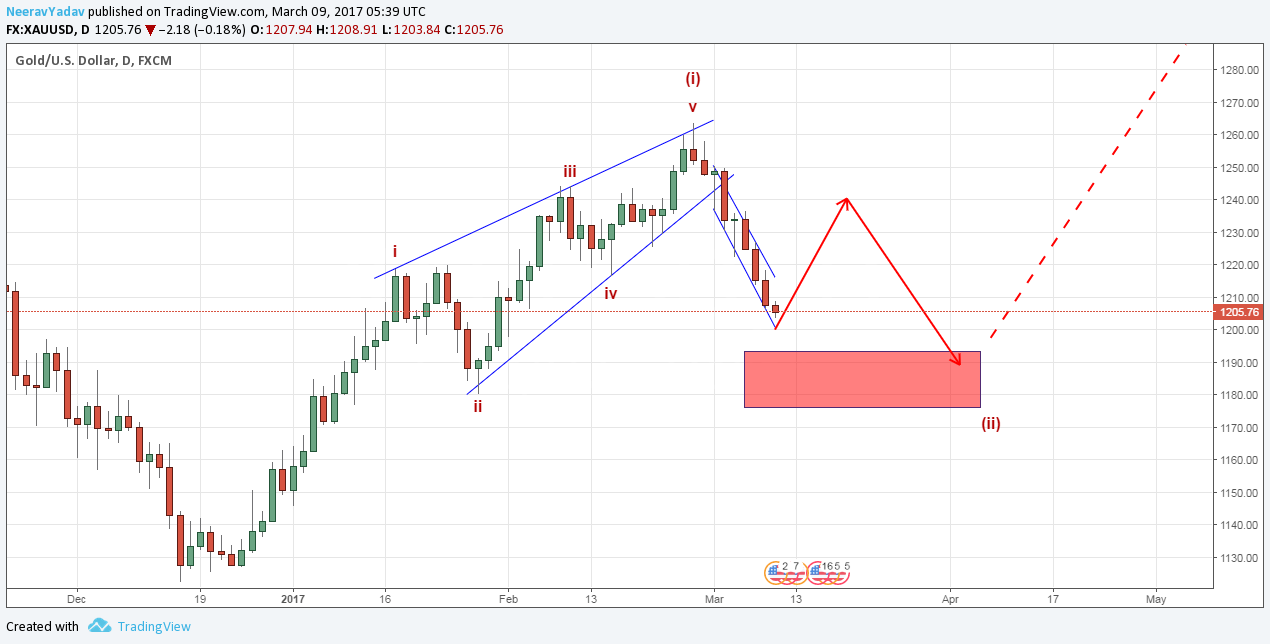
Gold Elliott Wave Analysis 9th March 2017 onwards
In view of this count the strategy for trading still remains the same, Gold is still a buy on dips, the essential levels are all been displayed on the chart.
I will update further as market progresses.
Learn to trade using Elliott Wave Principles – My Video Course
To receive these updates at the earliest you can subscribe to my Emailing List.
Disclaimer – All content presented here is strictly for educational purpose, do read the complete site disclaimer before taking any action.