It seems that we have just completed a Wave B Triangle and also broken above the b-d Trendline.
If this interpretation is correct then we can see next Wave C up till 4380-4700 levels.
Also if this pattern is incorrect then we can exit the longs below 3620 which is also the low of Wave e of the Triangle.
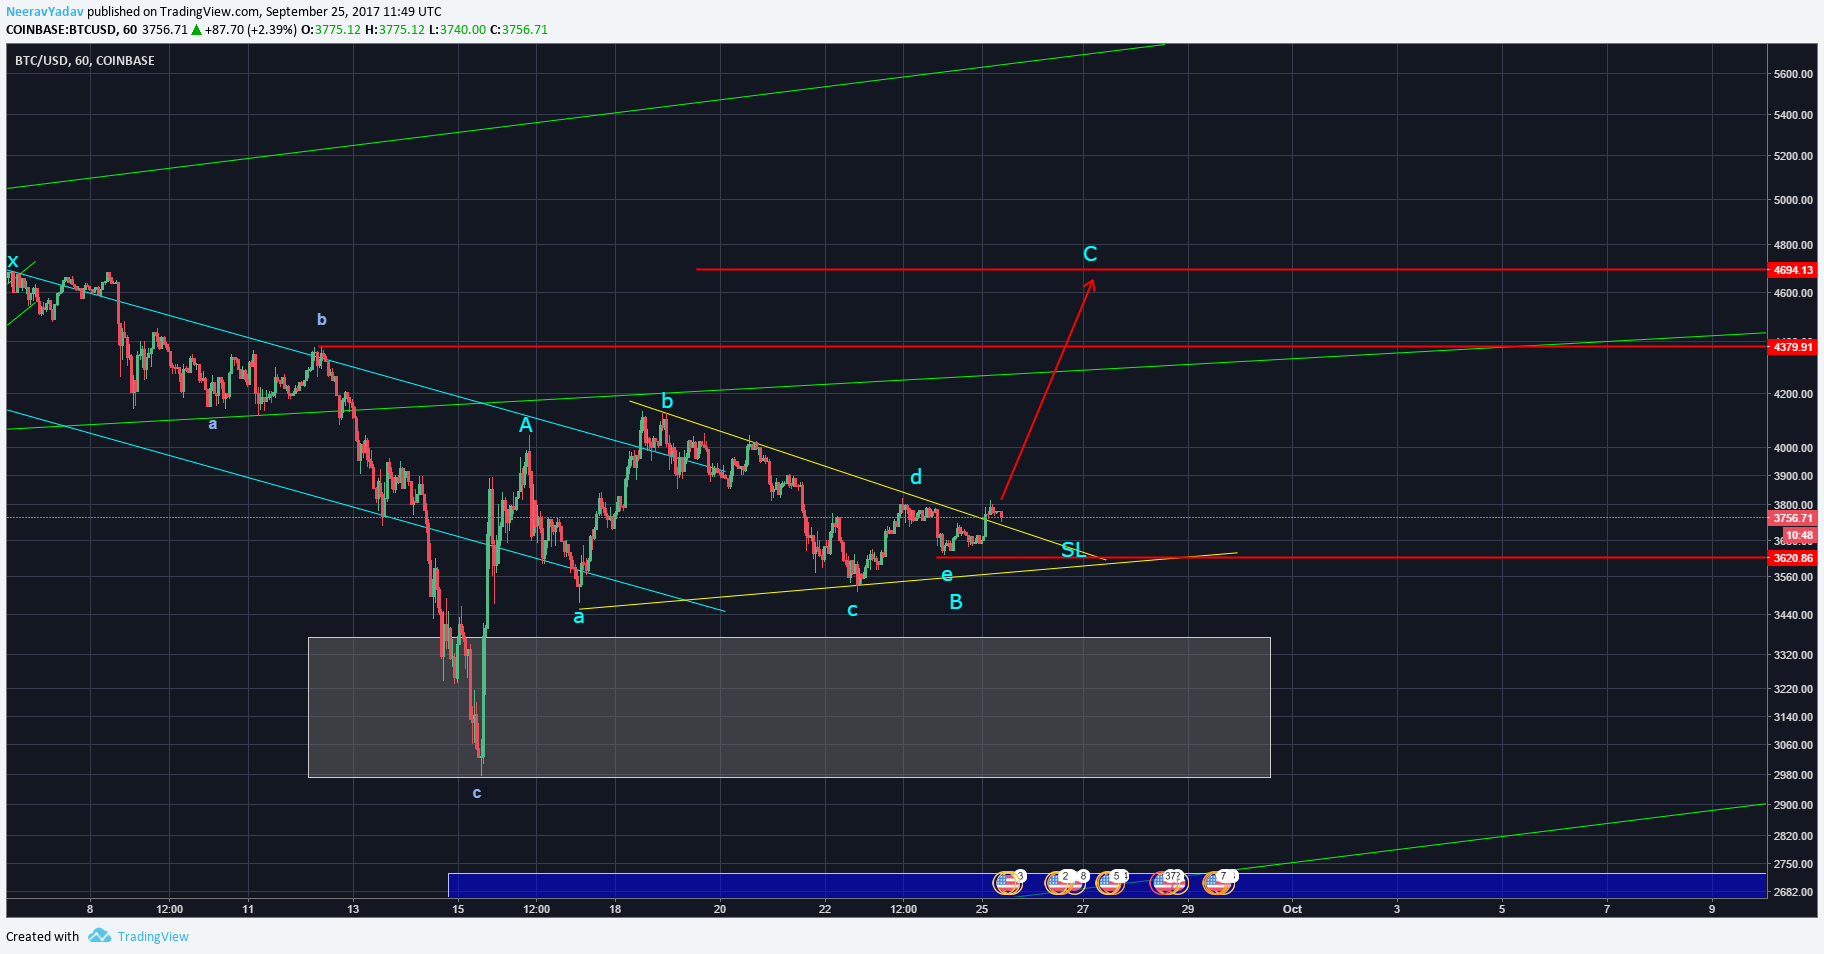
Bitcoin – Triangle broken to the upside, next Wave C to the upside
Overall this setup is offering a great Risk to Reward long trading opportunity.
Get 1 month free entry to the private group and learn to trade using Elliott Wave Principles – My Video Course
To receive these updates at the earliest you can subscribe to my Emailing List.
Disclaimer – All content presented here is strictly for educational purpose, do read the complete site disclaimer before taking any action.