In the last video analysis posted on 31 March, 2018 I discussed three possible scenarios with respect to Elliott Wave for Nifty (Index of Indian stock market), however there was a possibility that I didn’t discuss for the same I’m writing this article.
This case of the Ending Diagonal suggesting that we are currently in Wave iv of the same, which suggests another leg down before the movement to the upside may begin.
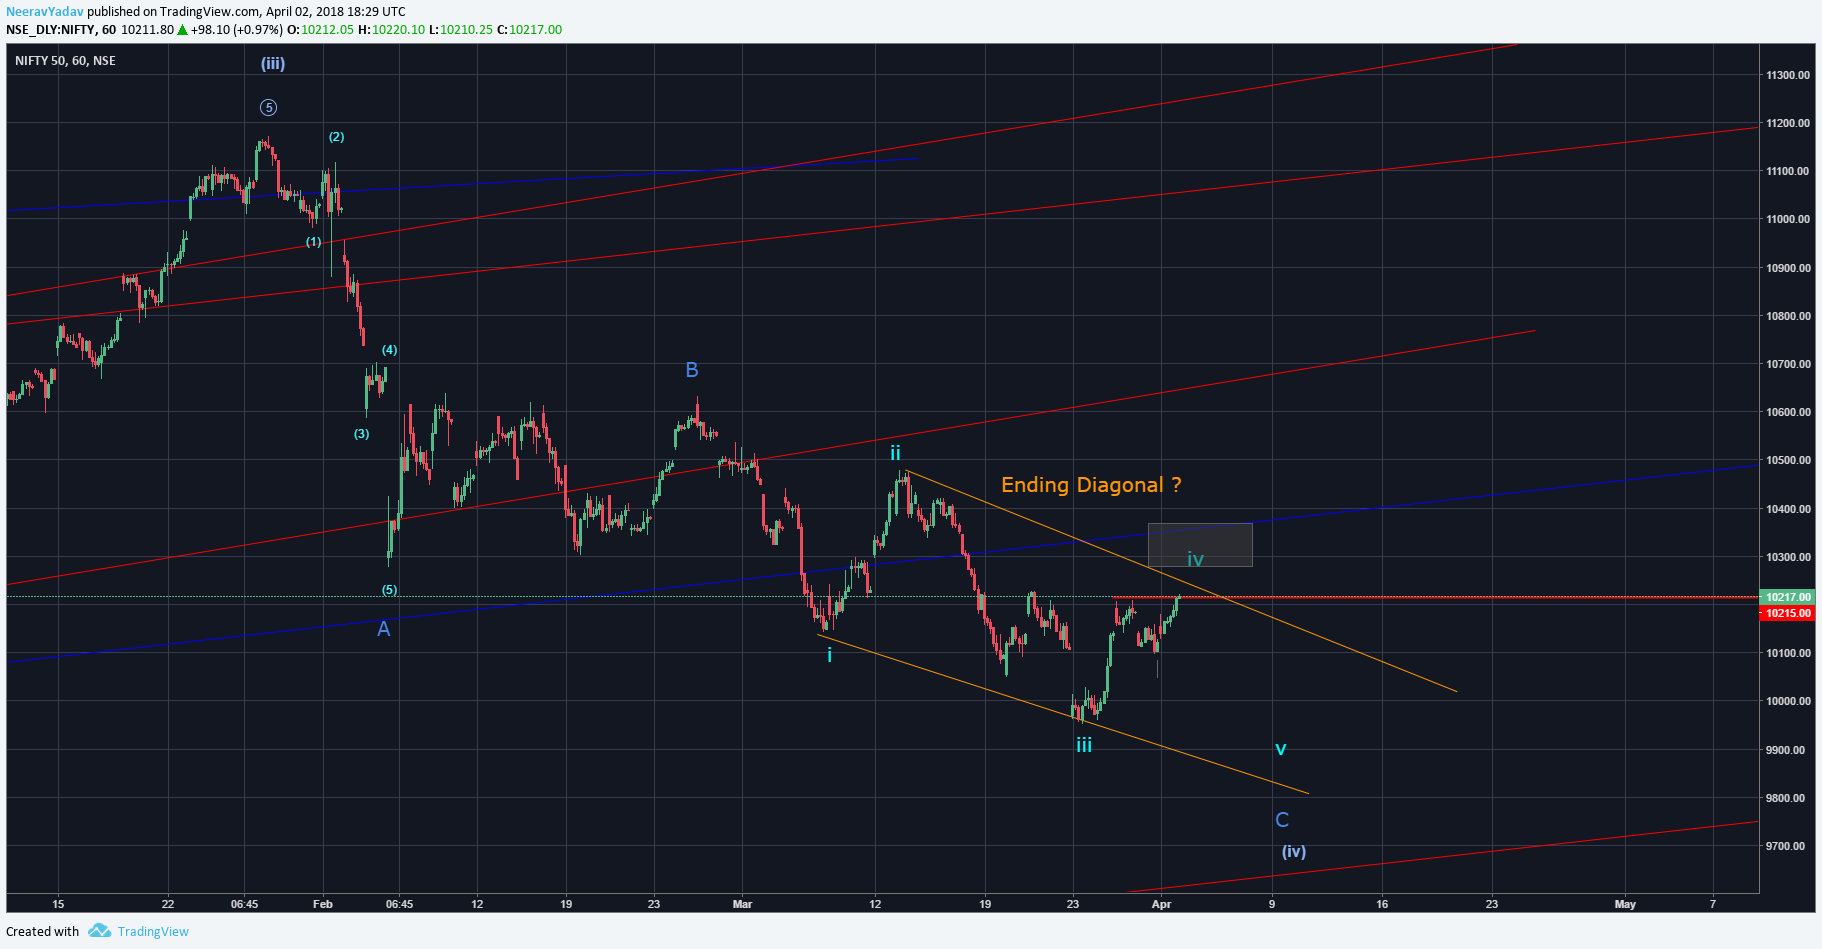
Nifty 50 possible Ending Diagonal April 2nd 2018
It is worth noting here that the structure is much more clearly visible on the chart of SGX Nify (Nifty Futures contract traded on the Singapore Exchange) as all the internal waves of the supposed ending diagonal clearly look like 3 wave structures on this chart.
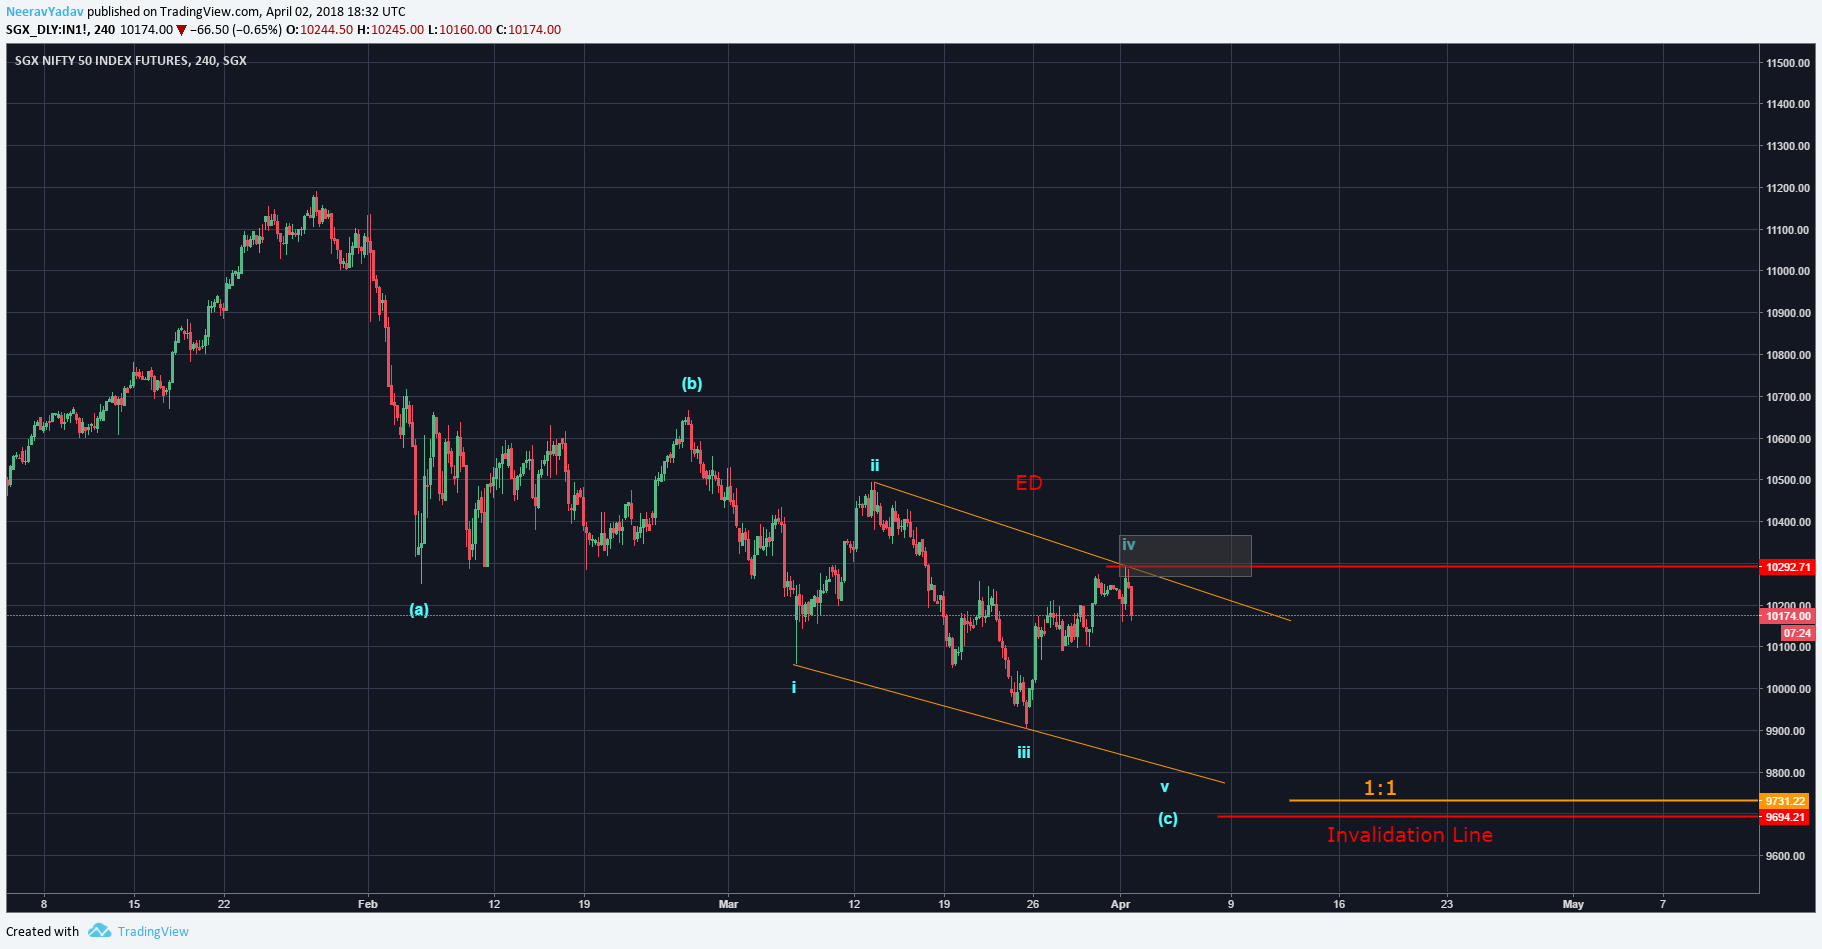
SGX Nifty possible Ending Diagonal
Another important thing worth noting on this SGX Nifty chart is that the Wave iii is a bit smaller then Wave i, hence we can project the length of Wave iii from the start of Wave v and see the maximum length Wave v can travel, reasoning here being that Wave iii can not be the shortest.
If we assume that Wave iv is already complete on this SGX Nifty chart at the level of 10292 then as per the above reasoning Wave v should be lesser than 9704.
The same reasoning can not be applied on the Nifty chart as the Wave iii of Ending Diagonal on it is a bit bigger then the Wave i of the same.
Also the same aligns with my bearish view of SPX (Index of American Markets) as discussed on 26th March.
Details regarding one to one training : Click Here
Get 1 month free entry to the private group and learn to trade using Elliott Wave Principles – My Video Course
To receive these updates at the earliest you can subscribe to my Emailing List.
Disclaimer – All content presented here is strictly for educational purpose, do read the complete site disclaimer before taking any action.