In this article I will be discussing the entire movement of Nifty 50 from the 2240 lows in 2008 to the recent highs of 10000 + noted in September 2017.
From the lows around 2240 levels the movement seems to be in 5 legs up, and it seems that currently we are progressing in Wave 3 of this 5 legged up movement.
Since Elliott Wave is fractal in nature, hence this Wave 3 will again have 5 legs of itself within it, as of now it seems that we are moving in Wave v (Circled) of Wave 3.
It should be noted that a more bullish count is possible here which would suggest that Wave iii (Circled) is still progressing but to avoid any type of confusion I will not discuss that case here, I will cover that probability in the next youtube video on Nifty.
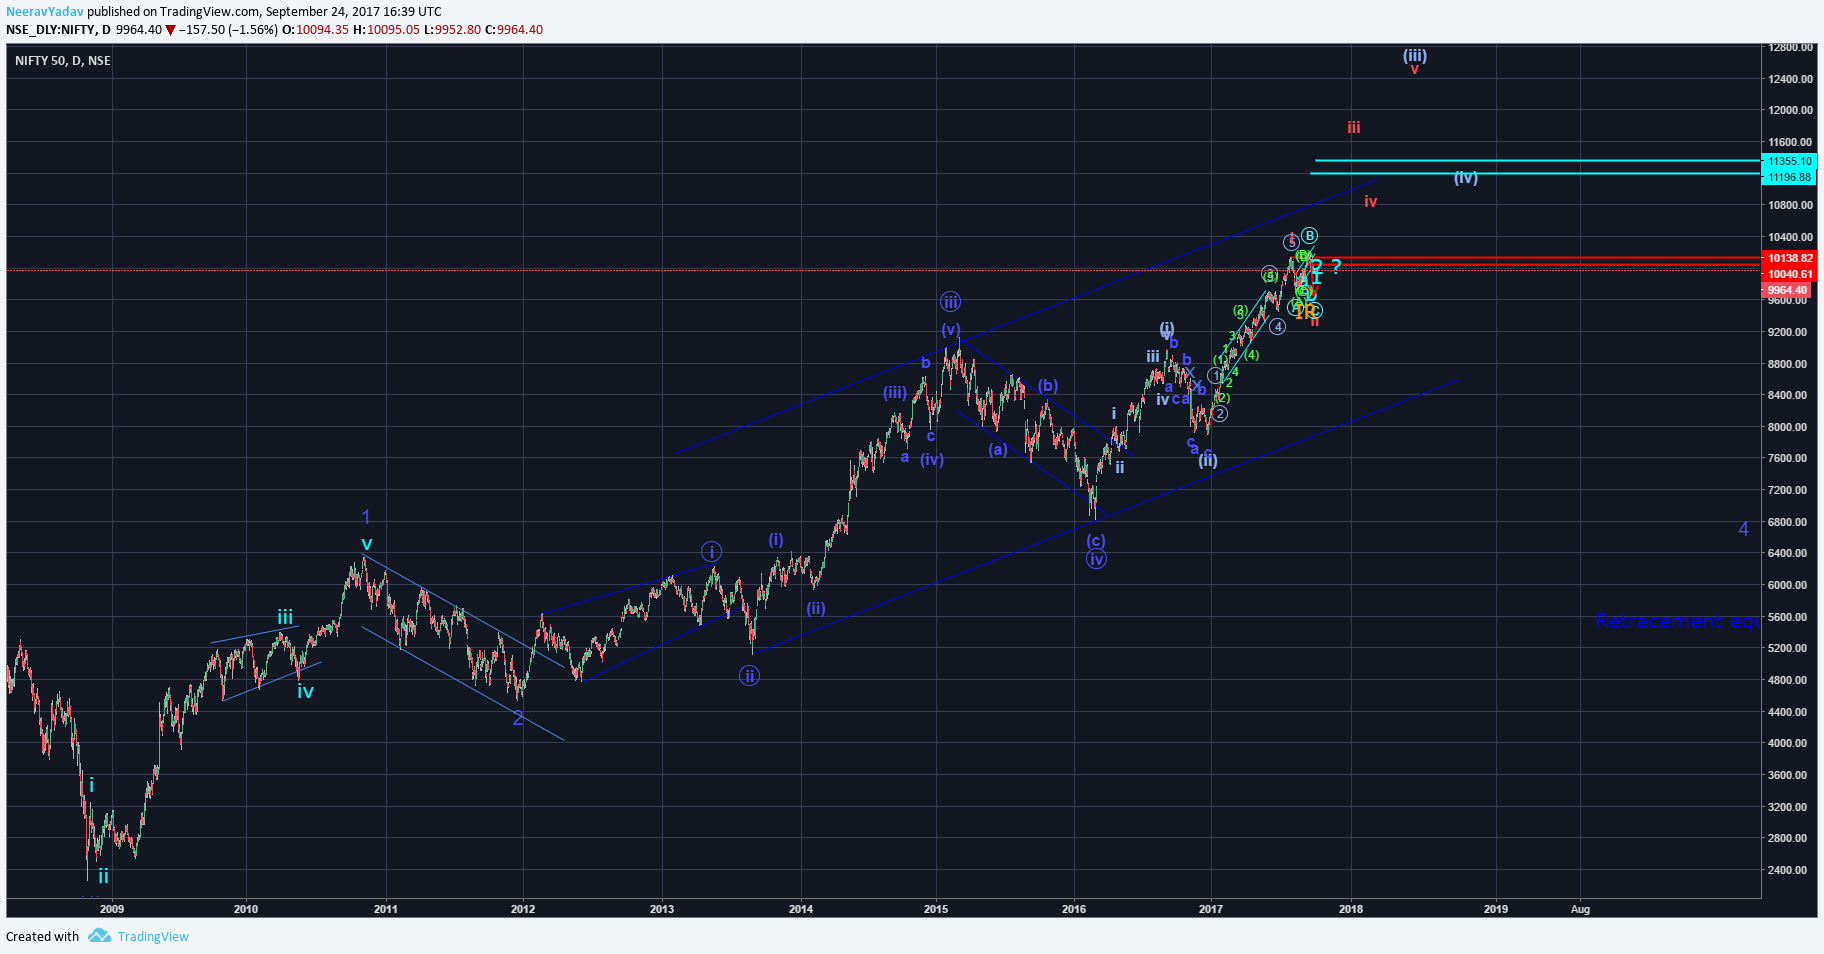
Nifty Daily Chart – The start of an Impulse leg from 2008 lows.
Continuing with the count discussed in the above chart we will now focus on the movement after Wave iv (Circled).
The movement up from Wave iv (circled) only has 3 legs so far.
From the Wave iv (Circled) we can currently see only 3 legs up, now since Wave v (Circled) is required to have 5 Waves of itself hence from a long term perspective we are required to have one more leg up.
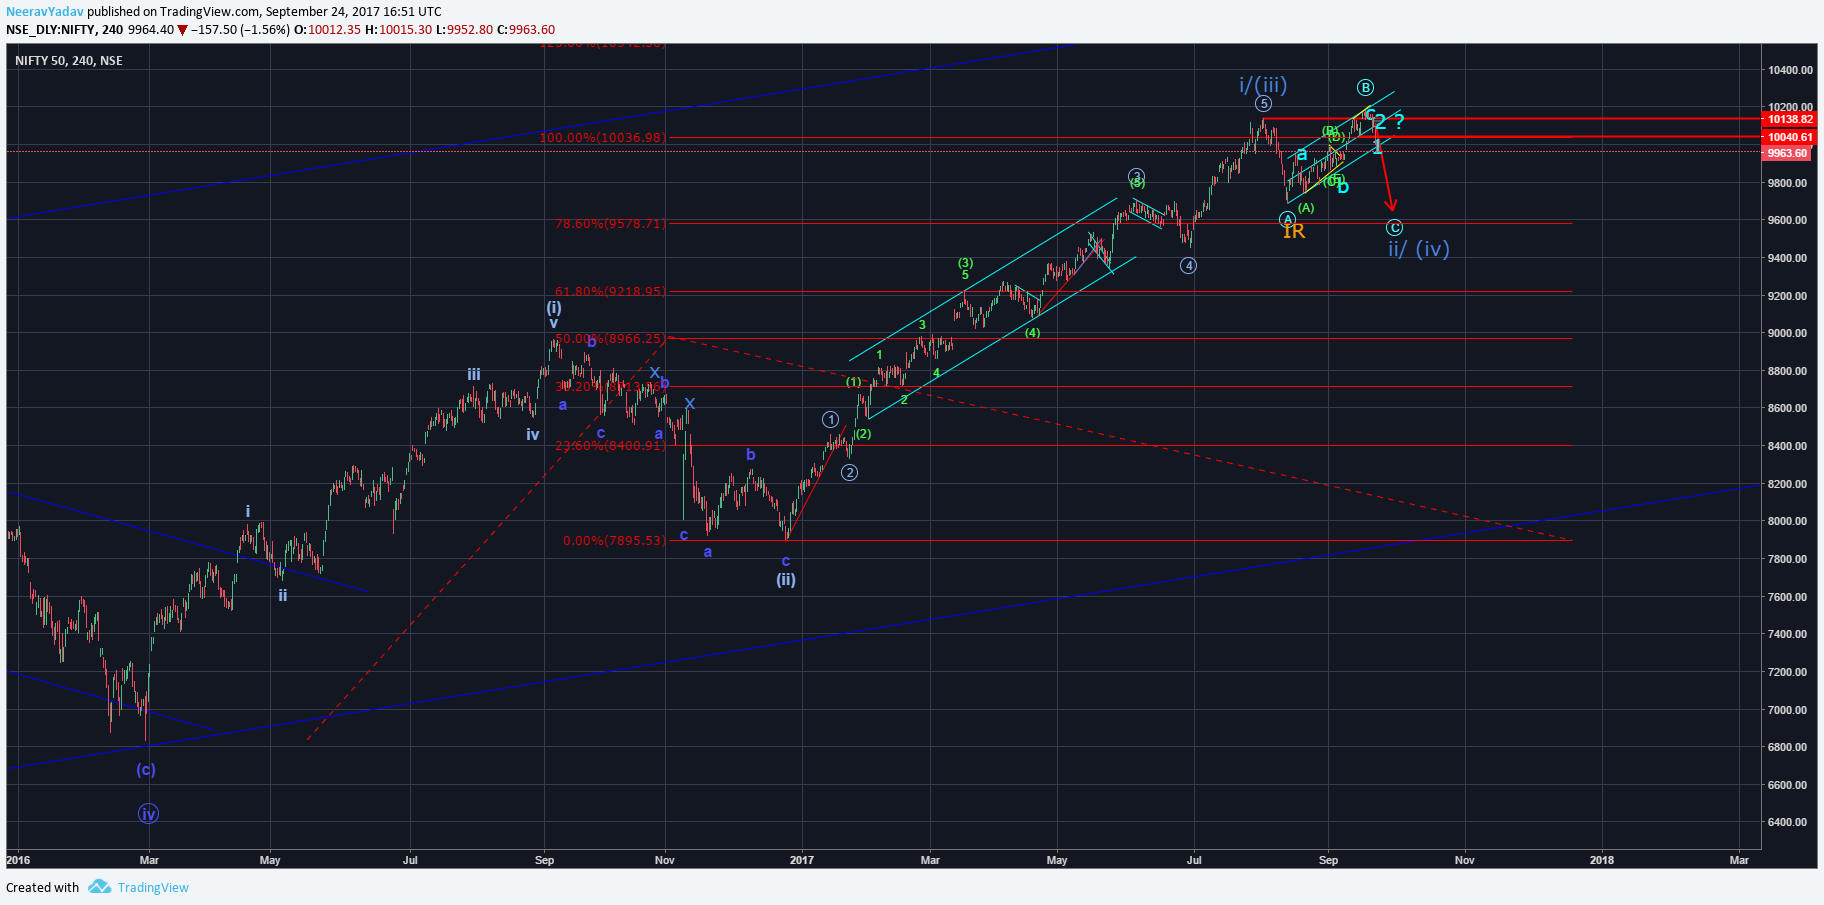
The 2 Hypothesis forming in Wave v (Circled) :
- After the Wave iv (Circled) the upward movement can be seen as Wave (i) of Wave v (Circled) followed by Wave (ii) of Wave v (Circled) followed by Wave i of Wave (iii) of Wave v (Circled) which completed near 10138, this count would suggest that the Wave (iii) will see an extension, the reasoning behind this count is that Fibonacci projection of Wave (i) from Wave (ii) low gives us the measure of 3rd leg only a little above the 100% level and in general we like to see the 3rd leg somewhere near the 161.8% level.
- After the Wave iv (Circled) upward movement is simply Wave (i)-(ii)-(iii) and we are currently progressing in Wave (iv).
If we consider Hypo 1 then from a few months perspective we have atleast 3 legs up remaining till the completion of Wave v (Circled).
If we consider Hypo 2 then we have only one leg remaining for the completion of Wave v (Circled), which should take Nifty somewhere in the region of 11200 to 11350 or even higher.
Hence considering both the Hypothesis we can conclude that we have atleast 1 leg up remaining for the completion of Wave v (Circled) and that leg should take Nifty to 11200 or higher targets in the coming months or maybe in the first quarter of 2018.
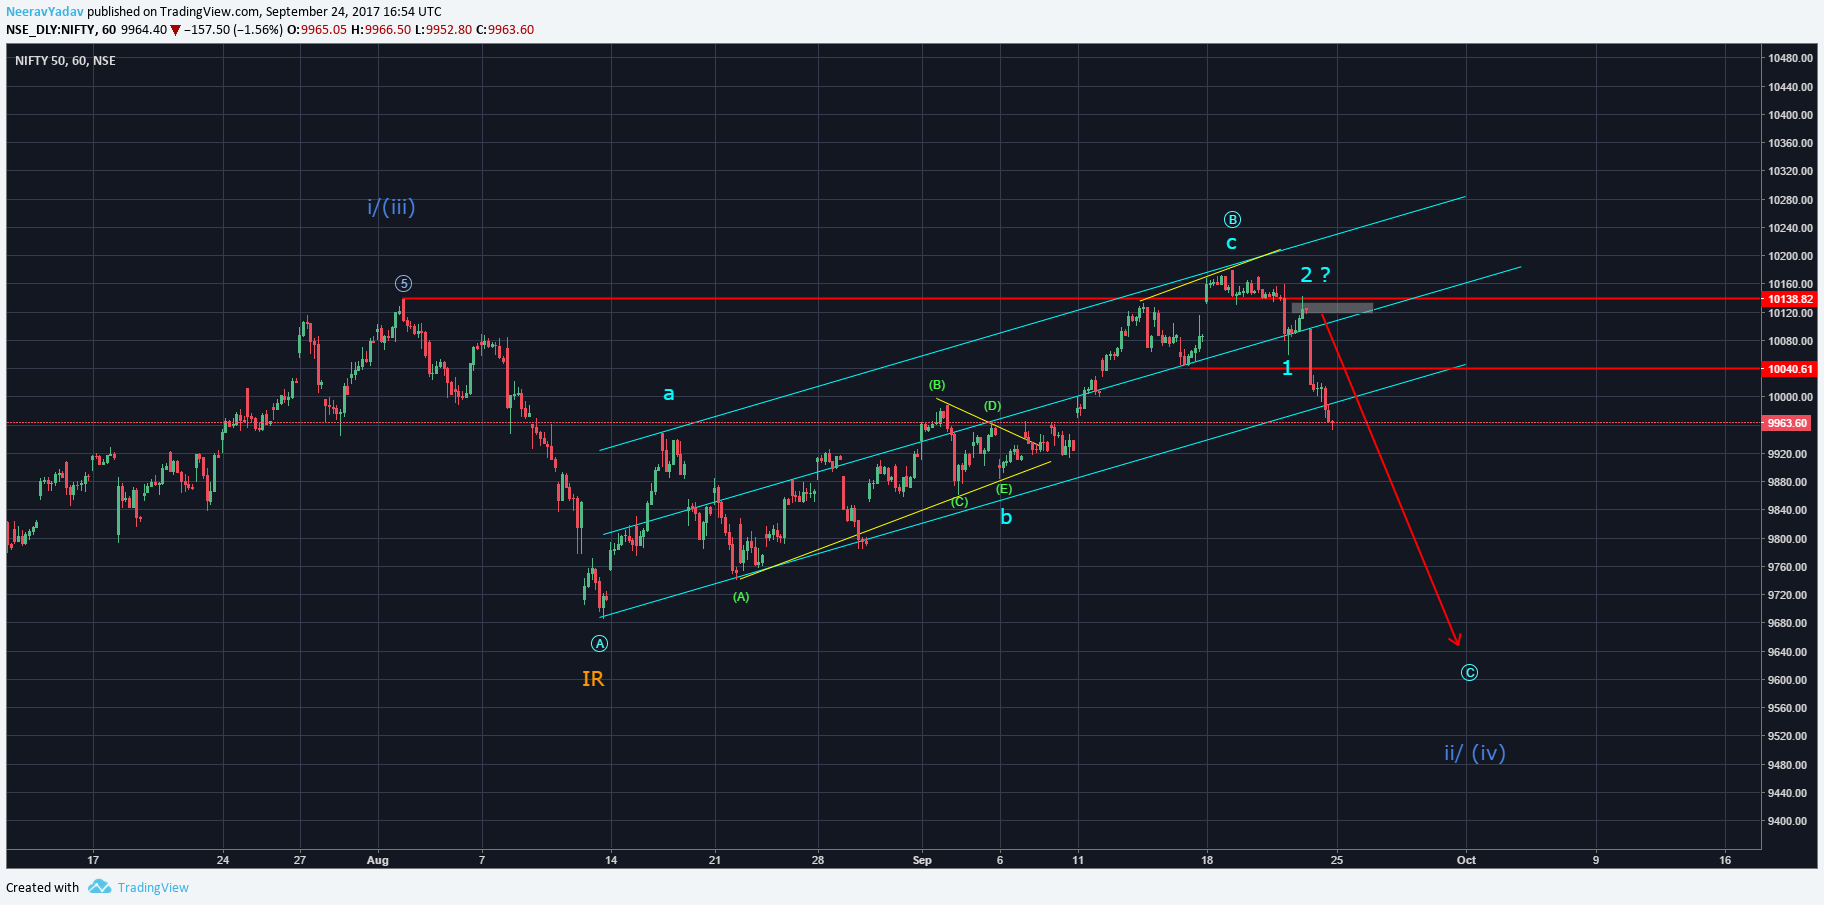
The movement up from 9690 consists of only 3 legs suggesting that it is a Flat structure.
Now looking at things from the current perspective as in the 1 Hour chart above, in case of both Hypothesis discussed above it seems that we are in a corrective structure and the corrective structure looks to be a Flat correction.
The current structure correction analyzed :
The movement up from the level of 9686 looks to be in 3 Waves, also note that Wave b of this move up is labelled as a Triangle which suggests that this leg will most likely get retraced by atleast 61.8% or 100%.
Hence the Targets for the Wave c of this Flat correction come out to be :
Target 1 : 9900
Target 2 : 9730
Target 3 : 9450
This analysis will be considered incorrect if the market crosses the Invalidation level of Wave 2 high that is at 10141.
Also there lies the probability that this correction can further continue to take the shape of some form of complex correction but even in that case it is highly likely that atleast the Target 1 will be achieved.
The only bullish Wave structure that I can think of at this point in time is that the movement from 9686 consists of a lot of Wave 1-2-1-2-1-2 structures and not a triangle but that is a very low probability case.
Conclusion :
Hence for now the situation suggests that we will see a fall for the upcoming session in this Flat correction for the Wave c, which can take Nifty till 9450 levels and once this correction is complete Nifty should resume the up move and see levels of 11200 or higher.
Get 1 month free entry to the private group and learn to trade using Elliott Wave Principles – My Video Course
To receive these updates at the earliest you can subscribe to my Emailing List.
Disclaimer – All content presented here is strictly for educational purpose, do read the complete site disclaimer before taking any action.