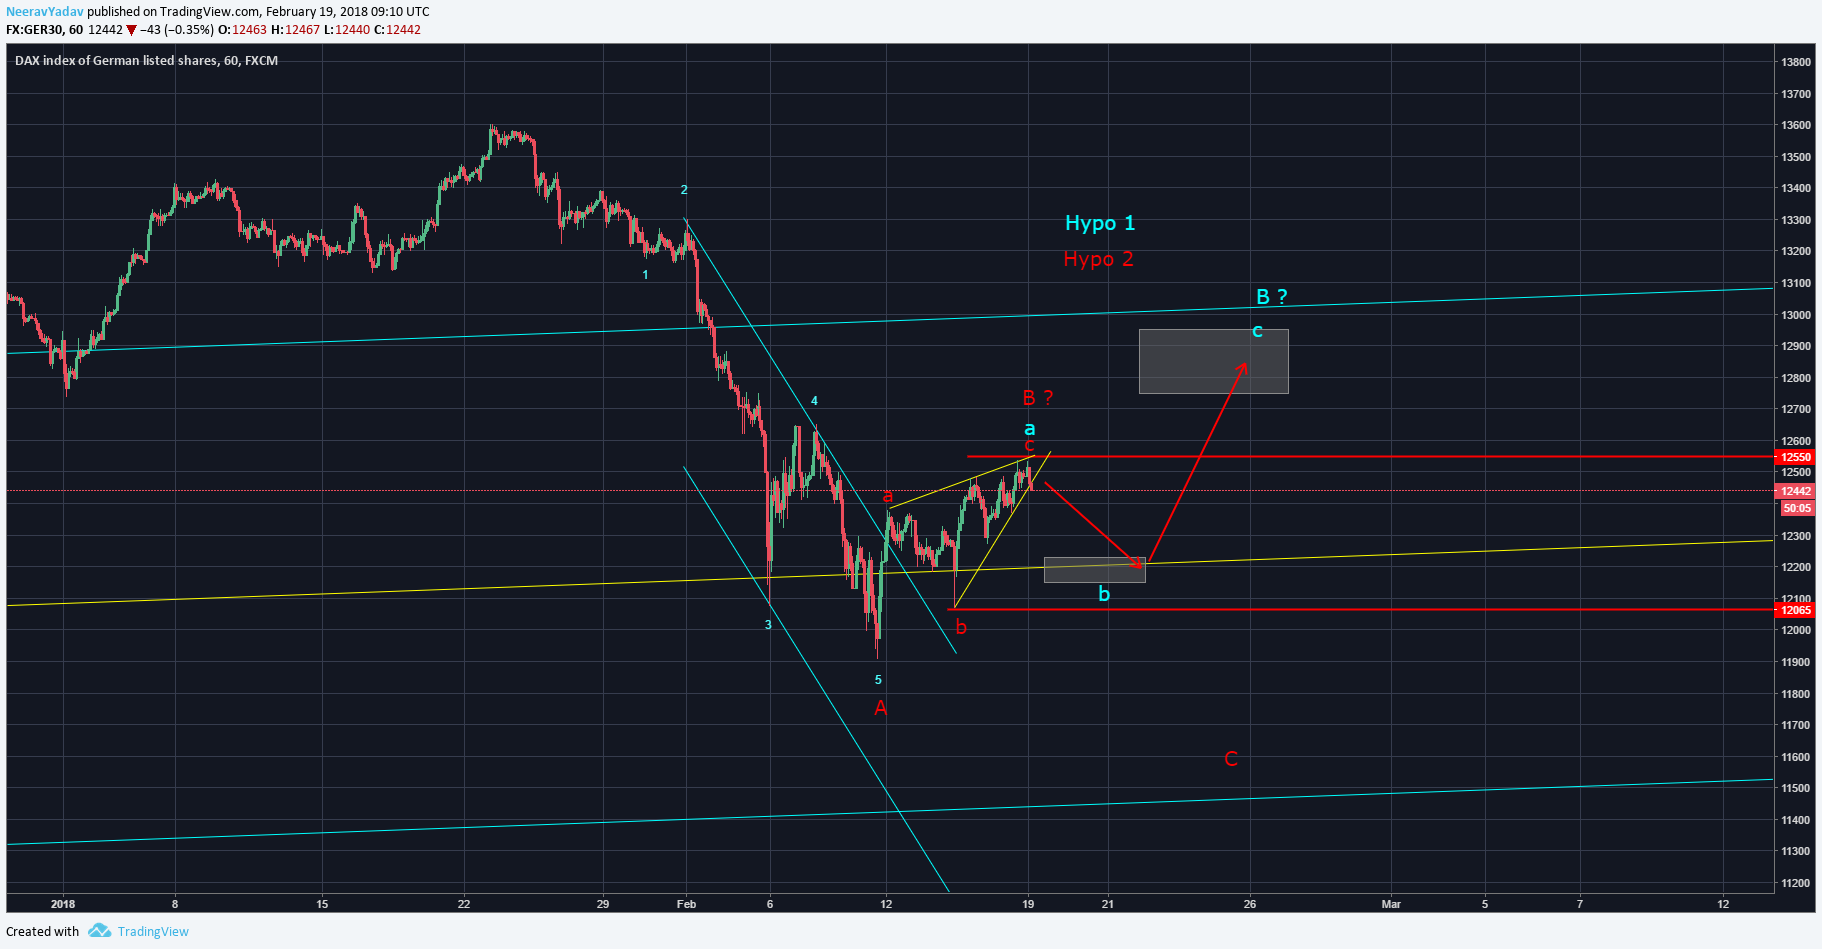
The Hypo 1 (Cyan) on the DAX 30 chart (Index of German Markets) suggests that we have completed the Wave a as a leading diagonal which suggests shorting for downside target of the white box support region.
However if we consider the more bearish Hypo 2 (Red) then we can say that the Wave c of Wave B was an Ending Diagonal and we can see for much lower targets in this case.
Since both the Hypos are pointing to the downside, it provides a very low risk shorting opportunity to us with SL just above the W.a (Cyan) high.
The white support zone which will also act as the minimum target zone in this case is coming at 12236-12150.
DAX 30 Elliott Wave Analysis 19th Febraury 2018 onwards
Get 1 month free entry to the private group and learn to trade using Elliott Wave Principles – My Video Course
To receive these updates at the earliest you can subscribe to my Emailing List.
Disclaimer – All content presented here is strictly for educational purpose, do read the complete site disclaimer before taking any action.