Skip to content
Back Home

Market Blueprint for the Professional Traders

Market Blueprint for the Professional Traders

  • Home
  • About us
  • Forecast Accuracy
  • Market Analysis
    • Commodities
      • Crude Oil
      • Natural Gas
      • Gold
      • Silver
    • US Markets
      • S&P 500
    • Indian Markets
      • NIFTY 50
      • Bank Nifty
      • NSE Stocks
    • European Markets
      • DAX 30
    • Forex
      • EURUSD
      • USDJPY
      • EURCAD
      • U.S. Dollar Index
      • EURJPY
    • Bitcoin
  • Email Subscription
  • Webinar Registration
  • Courses
    • Elliott Wave Course
    • Training Program LT
    • Think with the Markets Course
  • Book: Think with the Markets
  • Traders Resources
  • Testimonials
  • Social Media
    • Youtube
    • Facebook
    • Twitter
    • Instagram
    • FX Street
    • Trading View
  • Disclaimer
  • Site Policy
  • Contact Us
  • Members Login

Recent Posts

  • 163. SPX continues rally | Gold remains unclear | Trading Opportunities (Forex, Commodities, SPX & BTC)
  • 162. Gold set for new lifetime highs? | Trading Opportunities (Forex, Commodities, SPX & BTC)
  • 161. SPX set to correct? | Gold prepares to rally | Trading Opportunities (Forex, Commodities, SPX & BTC)
  • 160. GOLD hits targets again! What’s next? | Trading Opportunities (Forex, Commodities, SPX & BTC)
  • 159. GOLD & EURO extend winning streak | Trading Opportunities (Forex, Commodities, SPX & BTC)

Categories

  • Commodities
    • Crude Oil
    • Gold
    • Natural Gas
    • Silver
  • Cryptocurrency
    • Bitcoin
  • Detailed Analysis
  • Elliott Wave Analysis
  • European Markets
    • DAX 30
  • Forex
    • EURCAD
    • EURJPY
    • EURUSD
    • U.S. Dollar Index
    • USDJPY
  • Indian Markets
    • Bank Nifty
    • NIFTY 50
    • NSE Stocks
  • Indices
  • US Markets
    • S&P 500
    • US Stocks
  • Video Report
  • Webinar

Daily Archives: 24/09/2017


Detailed Analysis : Nifty can see a possible correction, Elliott Wave Forecast : Daily chart to 1 hour chart

This entry was posted in Detailed Analysis Elliott Wave Analysis Indian Markets Indices NIFTY 50 on 24/09/2017 by Neerav Yadav

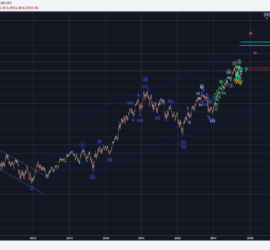
In this article I will be discussing the entire movement of Nifty 50 from the 2240 lows in 2008 to the recent highs of 10000 + noted in September 2017. From the lows around 2240 levels the movement seems to be in 5 legs up, and it seems that currently […]

Nifty Daily Chart - The start of an Impulse leg from 2008 lows


Risk Disclosure

Futures and forex trading contains substantial risk and is not for every investor. An investor could potentially lose all or more than the initial investment. Risk capital is money that can be lost without jeopardizing ones’ financial security or life style. Only risk capital should be used for trading and only those with sufficient risk capital should consider trading. Past performance is not necessarily indicative of future results.

Disclaimer

By viewing any material or information within this site or those sold or advertised through it you agree that this is general educational material and not an investment advice in any manner. You also agree that you will not hold anyone directly or indirectly associated with 50Eyes.com liable for any damage, loss or loss of profit that you might incur as a result of using any views presented on this site or those advertised thought it in your trading or investing. Read full site disclaimer before using any information provided here.

What we do

Trade and analyze Commodities, Indices, Stocks, Forex and Crypto using Elliott Wave and Price Action. Helping serious traders by providing educational content as videos, articles and in personal capacity. For getting notification of latest updates follow us either on listed social media sites or subscribe to emailing list.

· ® 50 Eyes Market Analysis ·