Bitcoin Case Study: Three Setups, Three Outcomes — Consistency in Action
What if it’s not about catching one big move…
but about being right again and again?
Most traders chase that one perfect trade.
But real consistency in the market doesn’t come from one lucky move.
It comes from repeating the same structured thinking across multiple setups.
This Bitcoin case study is not about a single trade.
It’s about three different market phases… three different expectations… and three outcomes that played out exactly as anticipated.
And that’s where things get interesting.
👉 Because predicting one move can be luck.
But doing it consistently across multiple market conditions?
That’s structure.
All these setups were discussed live by Neerav Yadav, who has been forecasting financial markets for over 10 years with an accuracy rate exceeding 80%, focusing on how markets actually behave — through structure, waves, and probability.
So the real question is:
👉 Is consistency in Bitcoin trading actually possible… or is it just a myth?
Key Takeaways from These Bitcoin Setups
Before we break it down, here’s what happened across all three discussions:
- ✔ Multiple Bitcoin setups discussed across webinars
- ✔ Market phases included wave 4 completion, impulse moves, and corrections
- ✔ Clear directional expectations were defined each time
- ✔ Bullish and bearish moves both captured
- ✔ All three setups resulted in expected outcomes (“+1” results)
- ✔ Demonstrates consistency, not just accuracy
Setup 1: The Breakout Above 110,000
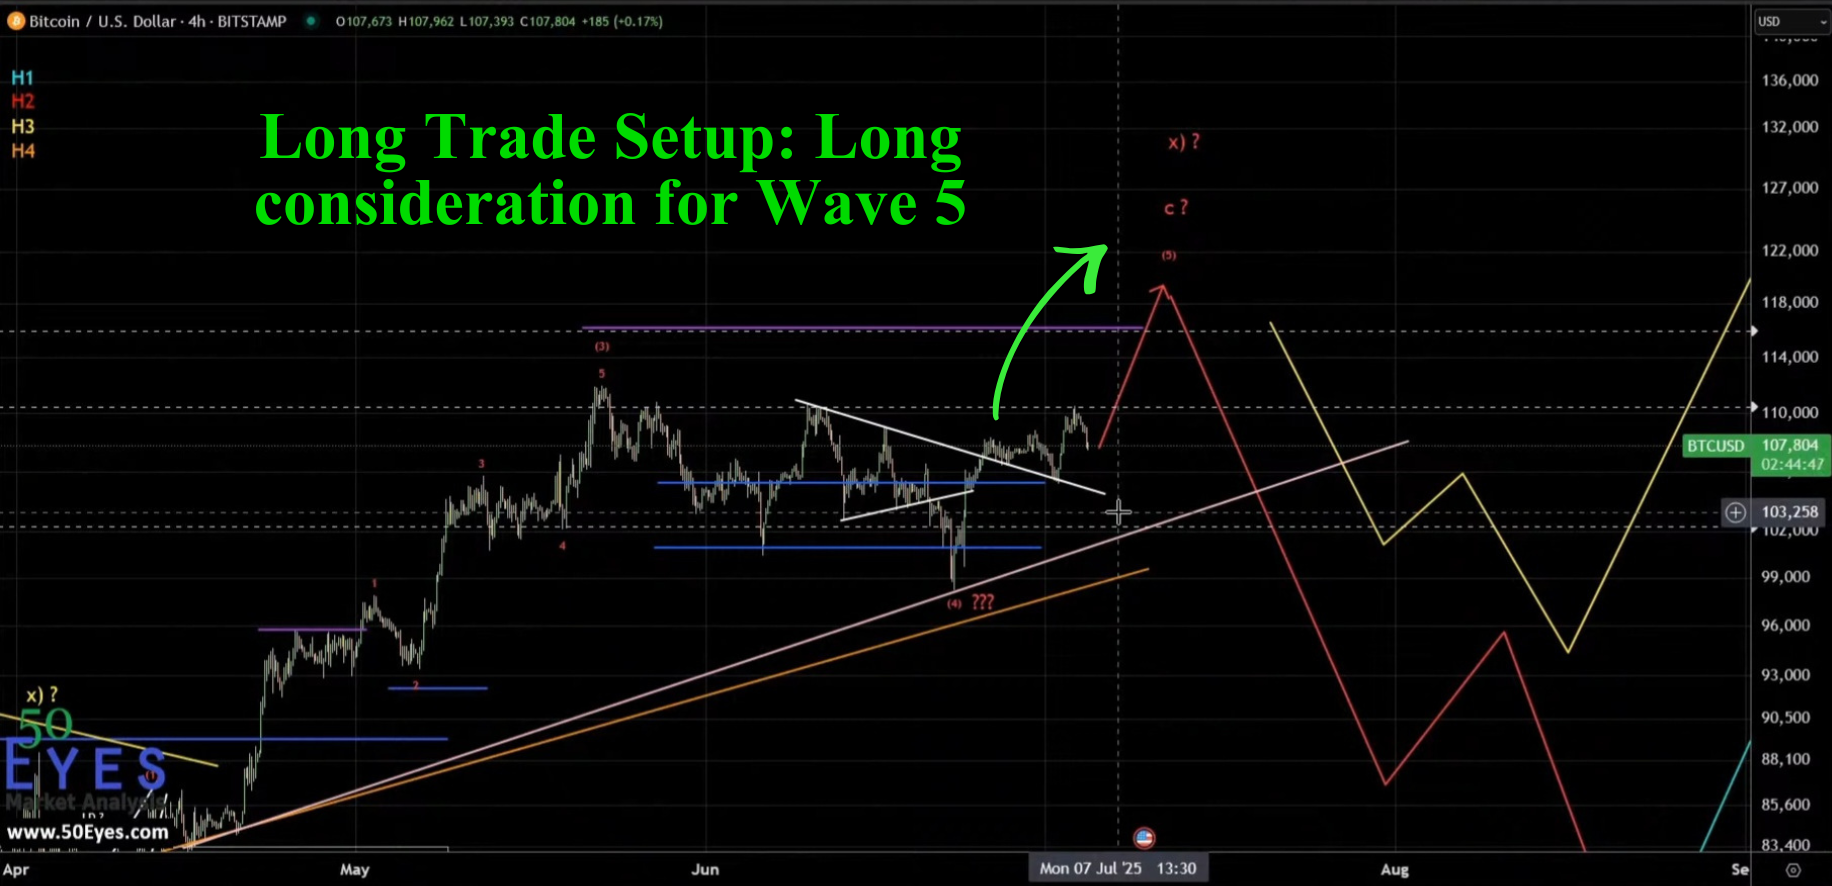
BTC long setup for wave 5
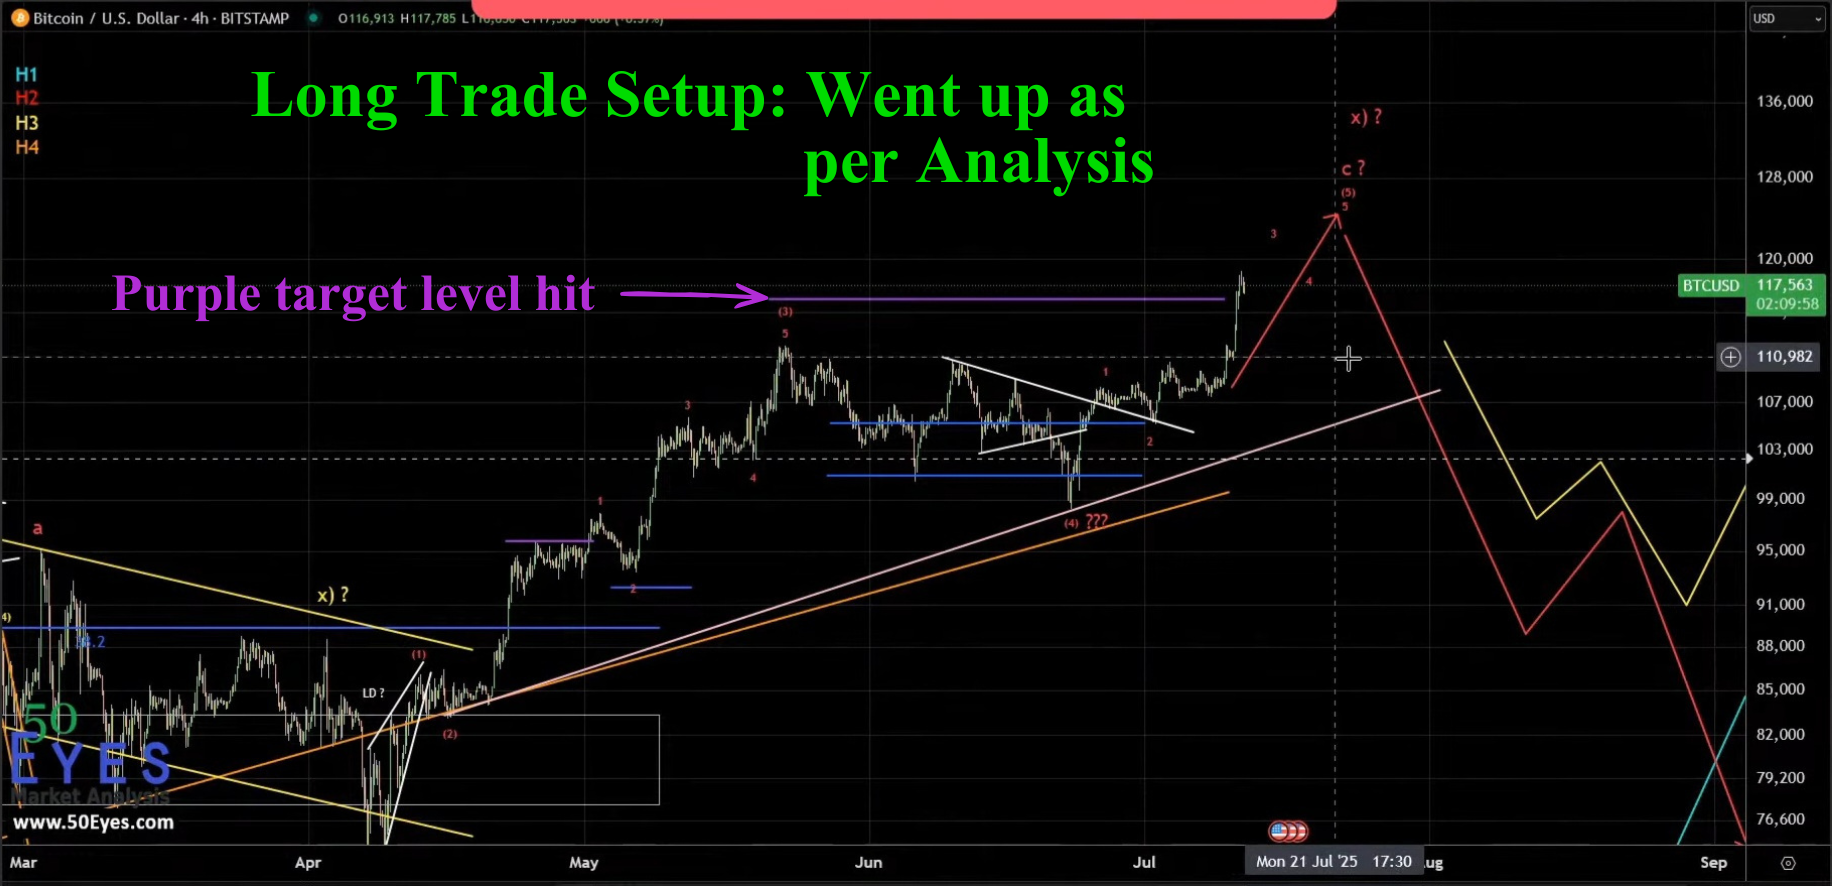
BTC long setup played out
🎥 Video 1 – Breakout Setup
Let’s start with the first setup.
During the webinar, the structure suggested that Bitcoin was in a wave 4 formation, and that wave 4 appeared to be complete.
👉 Which led to one key expectation: The market should give one more leg up
The trigger level was clearly defined:
- ✔ Long trigger above 110,000
Now this is important.
- ✔ Identify structure
- ✔ Define trigger
- ✔ Wait for confirmation
And what happened next?
- ✔ Bitcoin moved higher to around 117,563
- ✔ Exactly in line with expectation
- ✔ Marked as a “+1” outcome
Setup 2: Following the Impulse Structure
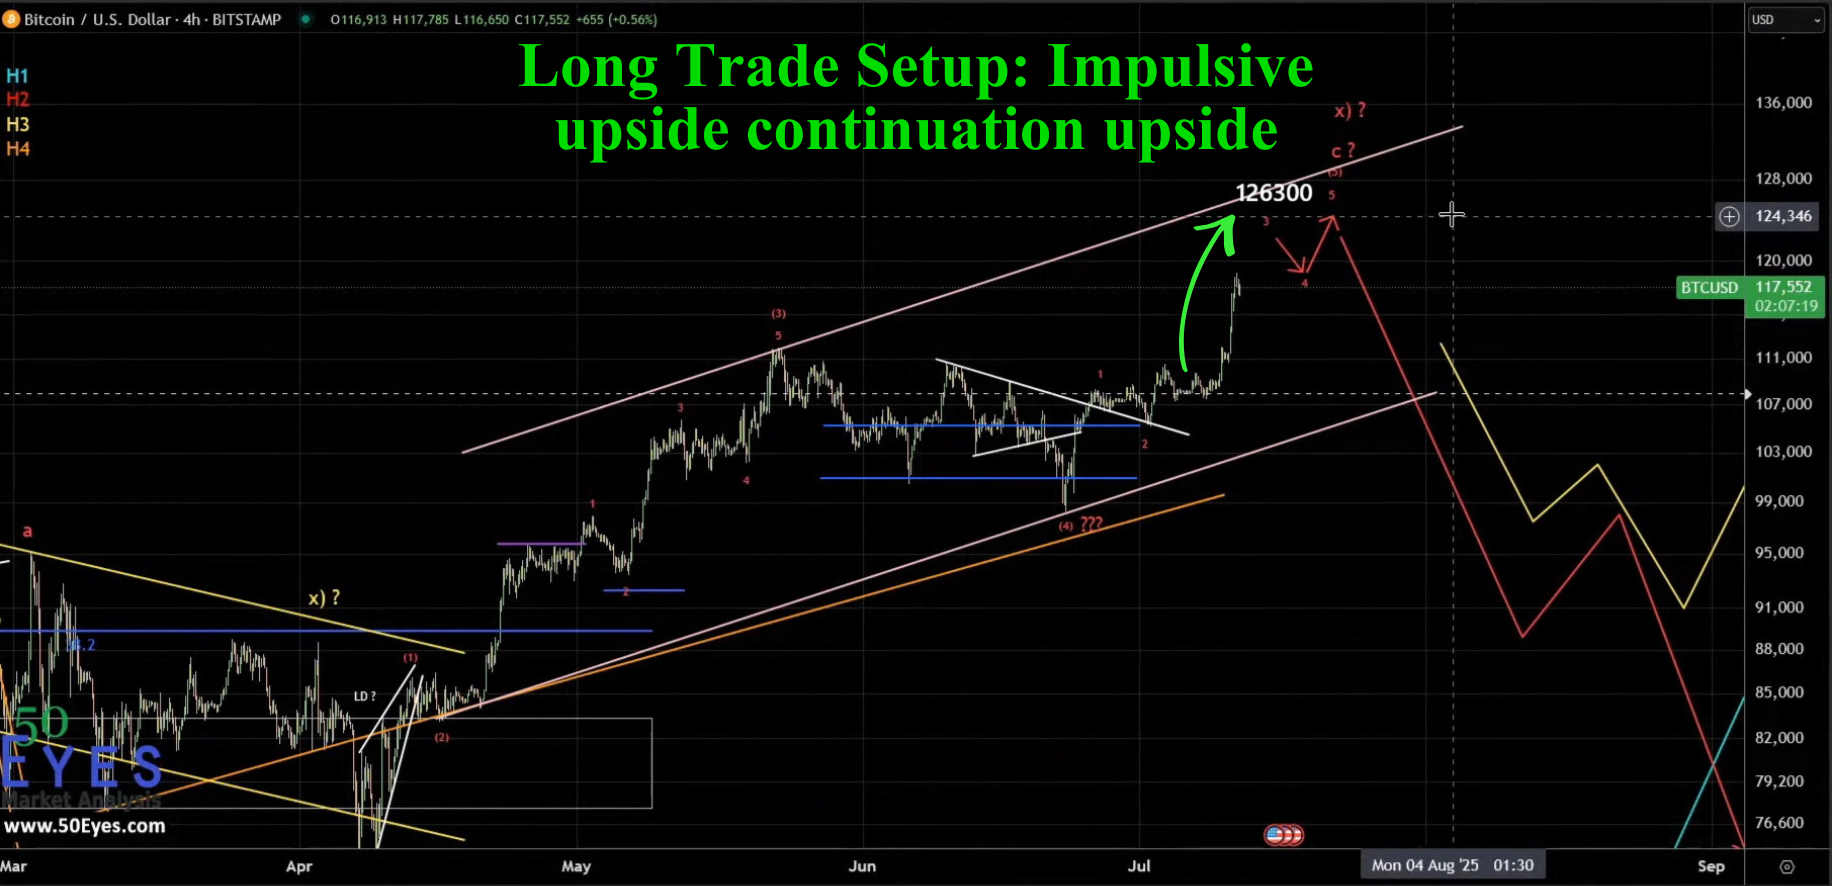
BTC long setup for impulsive continuation
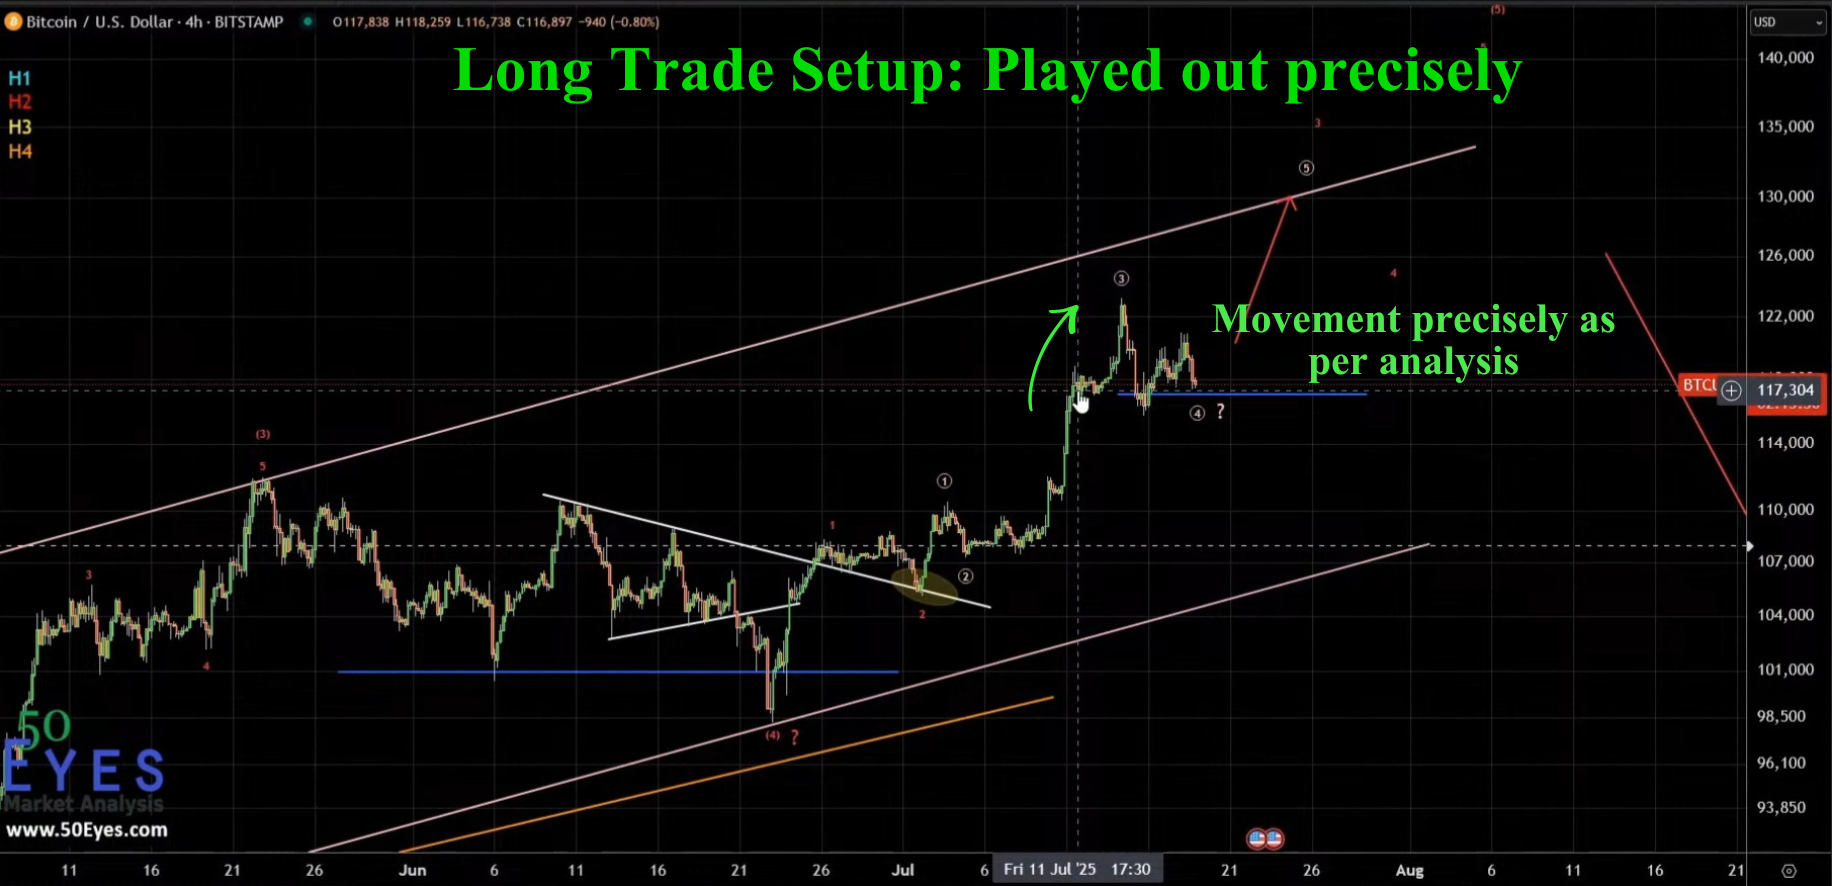
BTC long setup precisely played out
🎥 Video 2 – Impulse Structure
Now the structure evolved into an impulse formation.
- ✔ Wave 1 up
- ✔ Wave 2 correction
- ✔ Wave 3 expected (strong move)
- ✔ Wave 4 correction
- ✔ Wave 5 continuation
At this point, Bitcoin was around 117,667.
The key idea was continuation.
The market respected the structure once again.
- ✔ Bullish momentum validated
- ✔ Impulse progression confirmed
- ✔ Possible wave 4 correction anticipated later
👉 Another “+1” outcome
Setup 3: Anticipating the Pullback
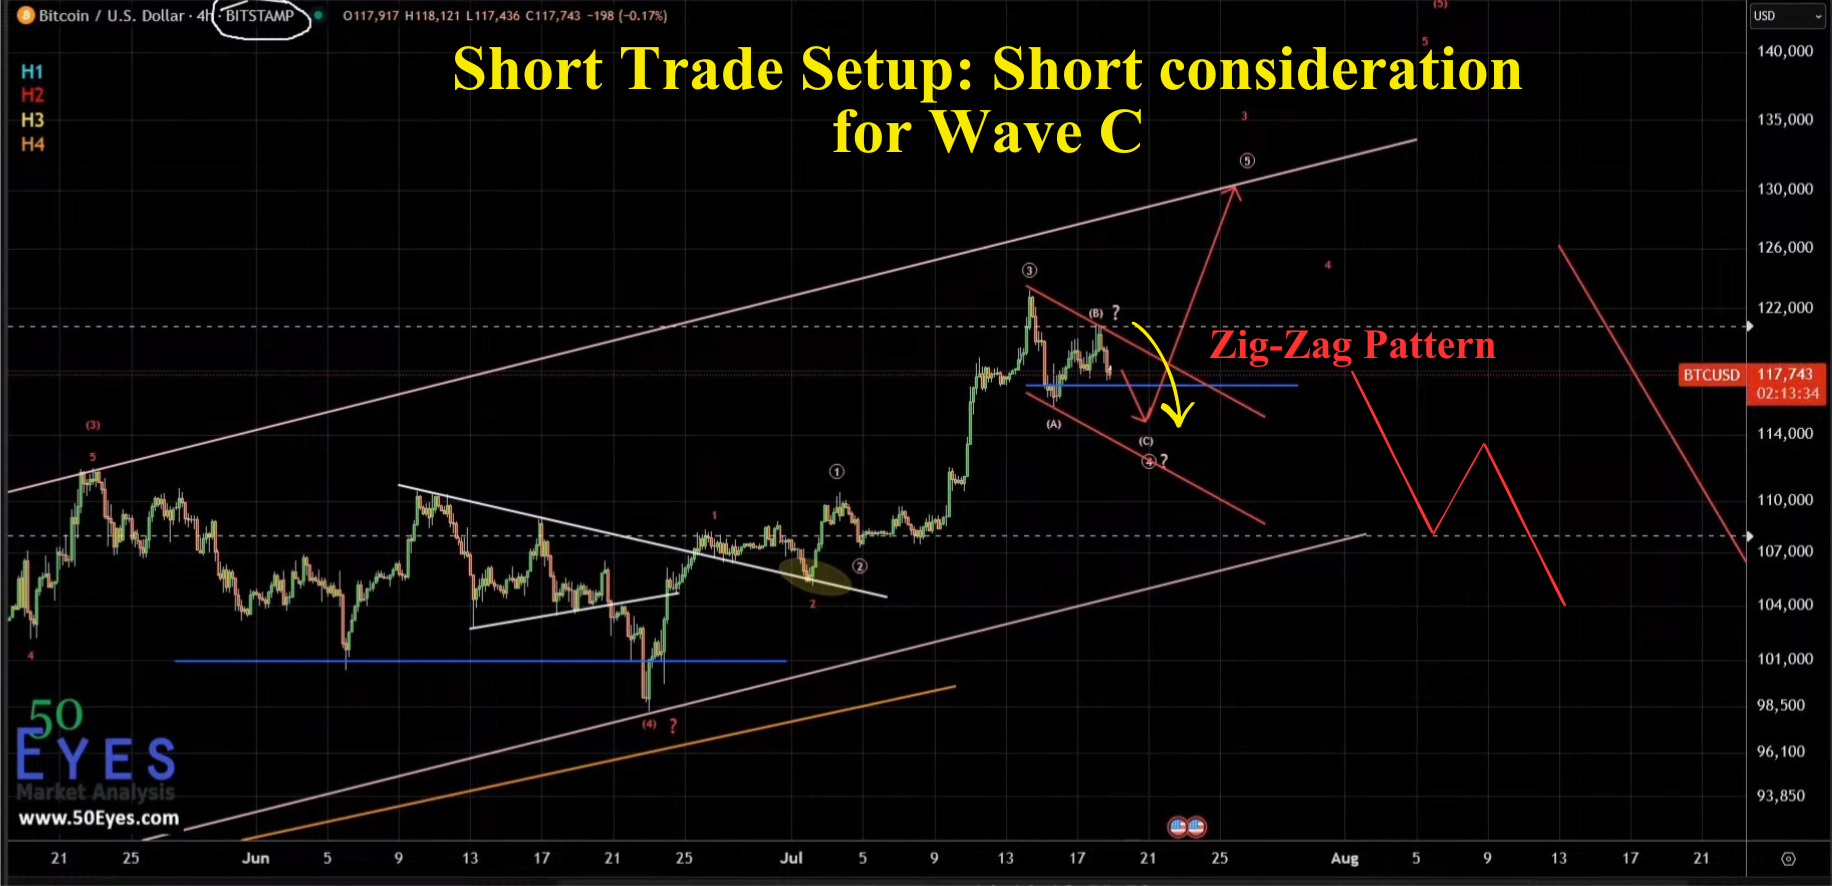
BTC short setup for wave C – Zig Zag pattern.
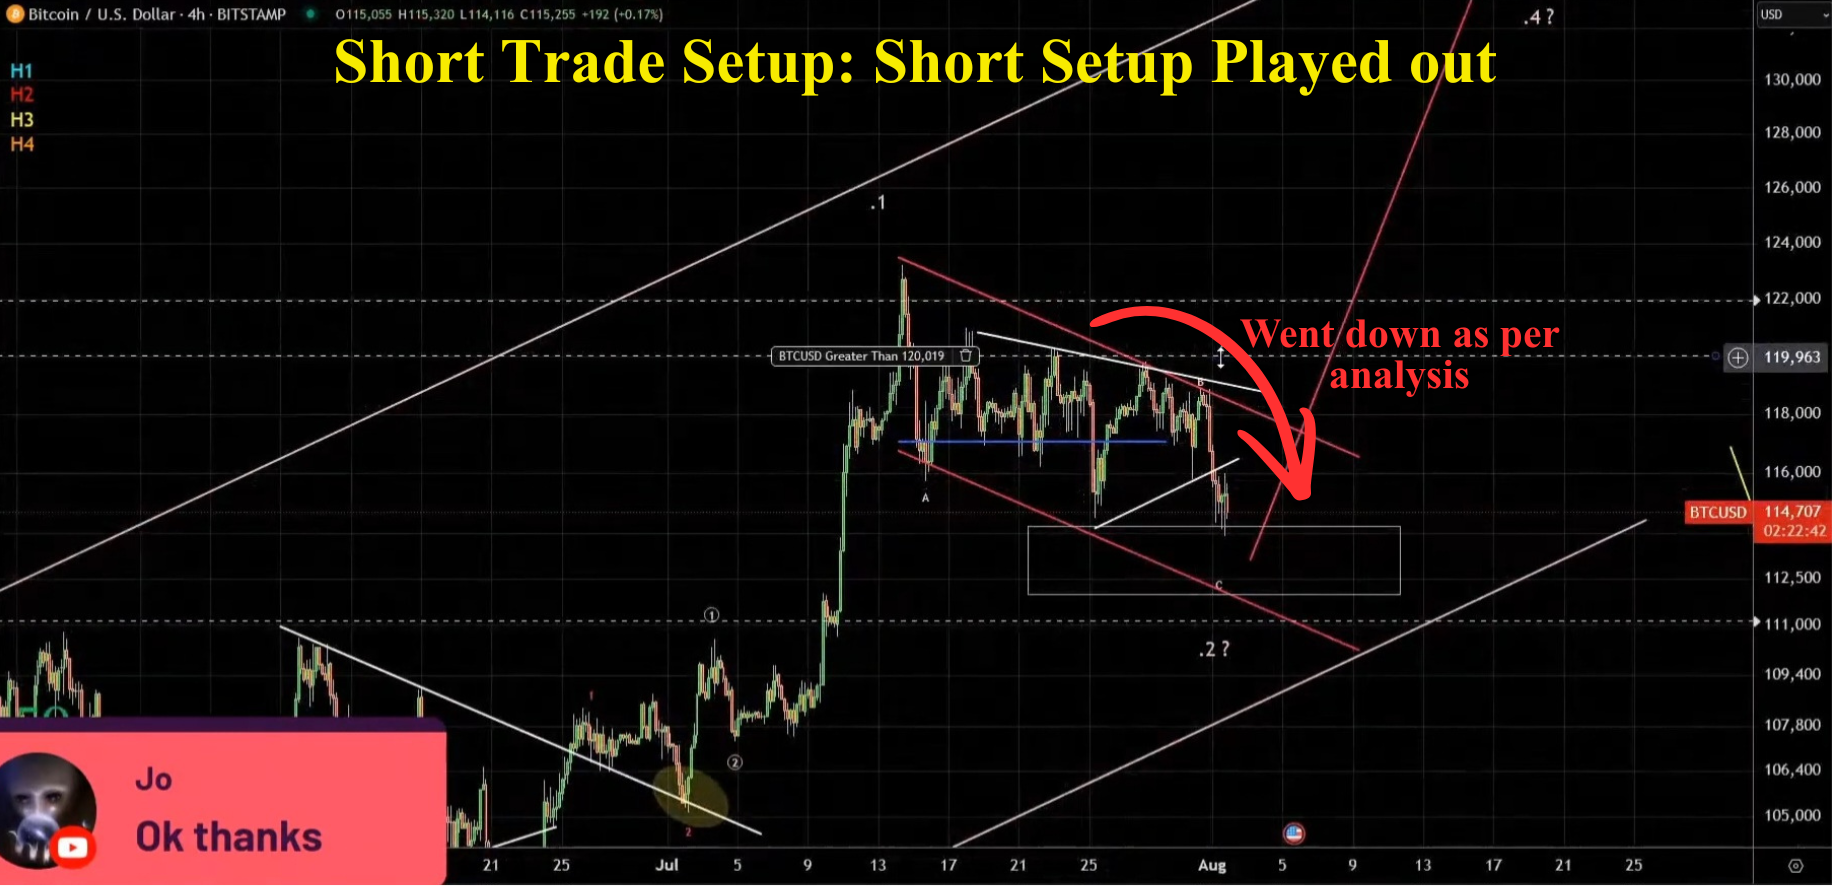
BTC short setup based on Zig Zag pattern played out
🎥 Video 3 – Pullback Setup
Now the bias shifted.
👉 A pullback (bearish move) was expected
- ✔ Wave 3 appeared complete
- ✔ Wave 4 expected
- ✔ Downward correction anticipated
Key level:
- ✔ Around 117,700
And the result?
- ✔ Bitcoin moved downward
- ✔ Wave 4 correction confirmed
- ✔ Third “+1” outcome
Three Setups. One Pattern.
- ✔ First → Breakout
- ✔ Second → Trend continuation
- ✔ Third → Correction
Different phases. Same framework.
👉 All resulted in expected outcomes
What This Bitcoin Case Study Really Shows
- ✔ Markets move in phases, not straight lines
- ✔ Structure helps identify what comes next
- ✔ Both bullish and bearish moves can be captured
- ✔ Consistency comes from process, not prediction
The Real Question
Are you following a structured approach… or reacting after the move?
👉 Because consistency comes from understanding — not chasing.
Related Bitcoin Case Studies
Explore how Bitcoin setups unfold across execution challenges and scenario-based analysis:
Missed-entry scenario highlighting execution challenges during strong rallies.
30% BTC Crash — Scenario Analysis
Scenario-based approach showing how a major downside move was anticipated.