What Happens When You Document Every Gold Forecast for 12 Straight Weeks?
Can Structured Gold Forecasting Survive 12 Consecutive Weeks?
Here is the answer for questions like these:
12 Consecutive Webinars | Forecast Before Move | Reviewed After Outcome
Anyone can get one market call right. The real test is consistency.
Over a 12-week period, structured gold forecasts were presented live — mapping upside levels, downside triggers, and invalidation zones before the week unfolded.
Some projections played out exactly.
Some partially validated.
Some failed.
Instead of showing only successful weeks, this case study reviews the entire sequence — because consistency is not built on perfection.
It is built on repeatability.
📊 12-Week Gold Forecast Record
This sheet documents 12 consecutive weekly gold webinars where projections were shared before the market moved.
Each entry includes:
- Market level at the time of forecast
- Projected upside and downside zones
- Actual outcome
- Points captured
| Week | Current Market Level | Forecast Given (H – Hypothesis) | Key Level | Outcome | Points Captured |
|---|---|---|---|---|---|
| Week 1 (Webinar-170) | 3352 | Market will go up and then move down. Upside Target- 3420+ Downside Target- 3250+ |
3420+ and 3250+ | ✔ EXACTLY PLAYED OUT, Market touched the trendline at 3430 and then move down to 3269 as analysed | 70 points in upside and 100 points in downside |
| Week 2 (Webinar-171) | 3346 | H1: Market can go down upto 3200 H2: Market can go upto 3500+ |
3200 and 3500 | ➖ NO setup was activated. | — |
| Week 3 (Webinar-172) | 3374 | H1: Market can go up to 3405+ H2: Market can go down to 3250+ |
3405 and 3250 | ✔ PLAYED OUT, Market go above 3405 | 50+ points |
| Week 4 (Webinar-173) | 3649 | H1: Market can go upto 3656 and 3700 | 3656 and 3700 | ✔ EXACTLY PLAYED OUT, Market touched the target 3700 | 50+ points |
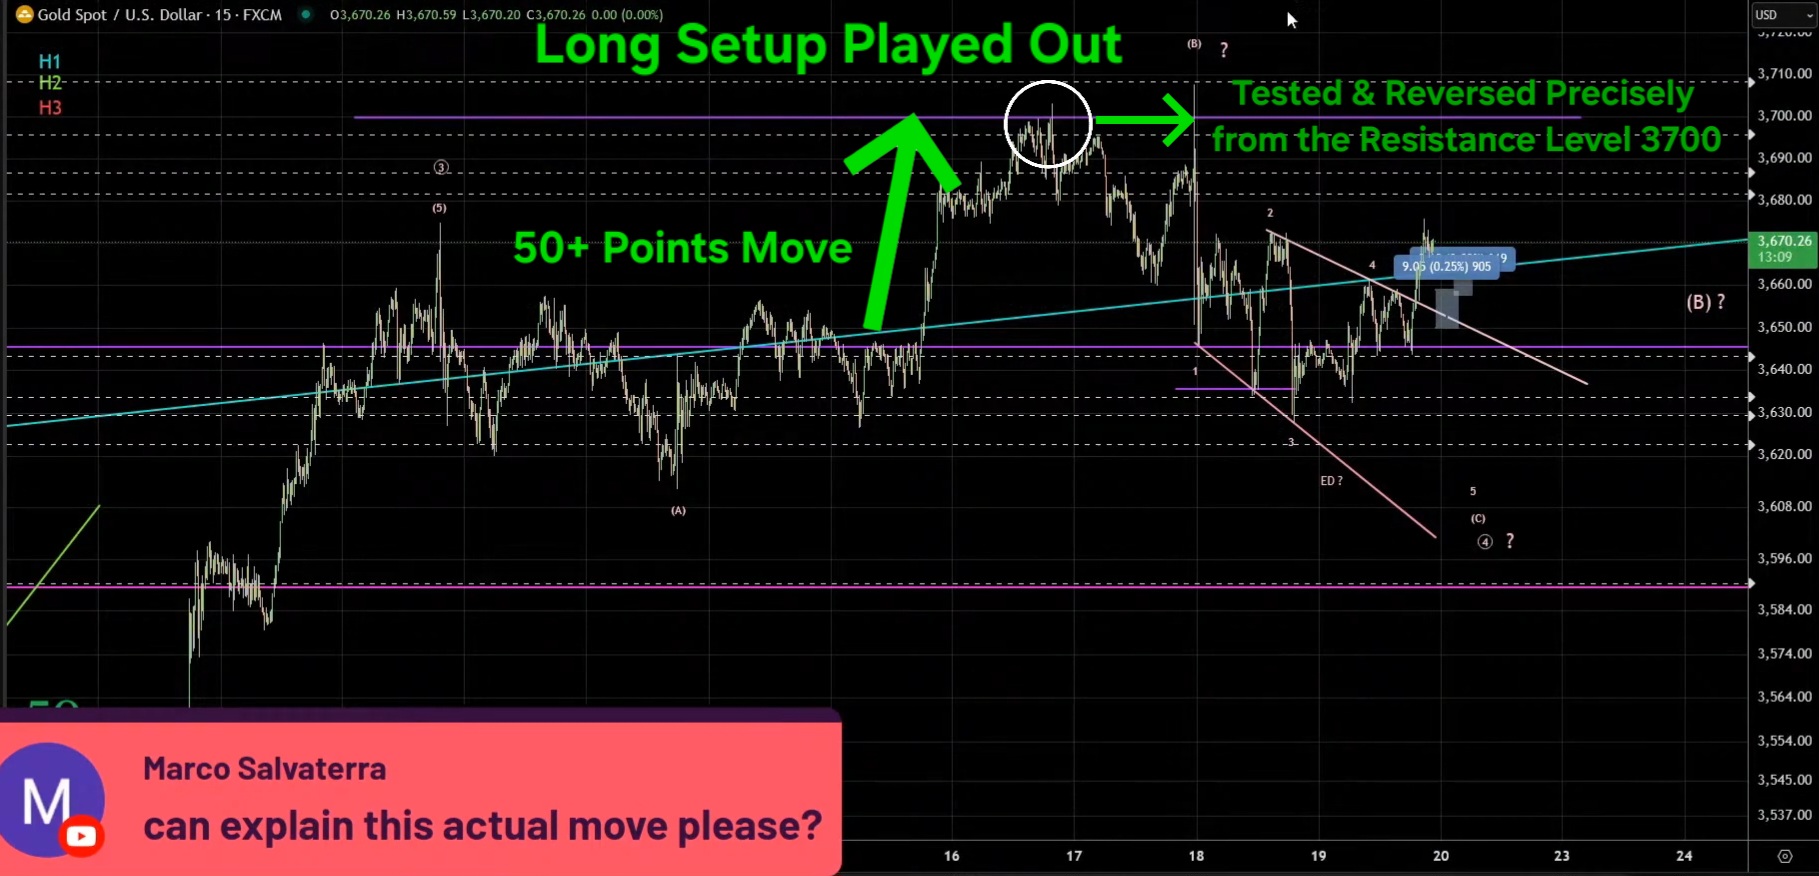
| Week 5 (Webinar-174) | 3670 | H1: Market can give a good bullish move above 3695+ | 3695 | ✔ EXACTLY PLAYED OUT, Market go upto 3778 | 80+ points |
| Week 6 (Webinar-175) | 3782 | H1: Upcoming Targets are 3875+ | 3875 | ✔ EXACTLY PLAYED OUT, Market go above 3875 | 90+ points |
| Week 7 (Webinar-176) | 3883 | H1: Next targets are 3936 and 4000+ | 3936 and 4000 | ✔ EXACTLY PLAYED OUT, surpassed all the targets | 100+ points |
| Week 8 (Webinar-177) | 3988 | H1: Next targets are 4053 and 4200+ | 4053 and 4200 | ✔ EXACTLY PLAYED OUT, Market go upto 4360+, surpassed all targets | 166+ points |
| Week 9 (Webinar-178) | 4239 | H1: Upside targets are 4480 and 4500 | 4480 and 4500 | ❌ Not as expected. Longs triggered with no follow through. | — |
| Week 10 (Webinar-179) | 4003 | H1: Long consideration above 4123
H2: Downside Targets are 3846 and 3720 |
3846 and 3720 | ✔ Long setup played out as market went above 4123. | — |
| Week 11 (Webinar-180) | 4102 | H1: Targres are 3846 and 3720 | 3846 and 3720 | ❌ Not as expected. | — |
| Week 12 (Webinar-181) | 4070 | H1: Upside Targets are 4120 and 4300++ H2:Downside Targets are 3935 and 3886 |
4120 and 3935 | ✔ EXACTLY PLAYED OUT, Market crosses the 4120 and go upto 4251+ | 100 points |
Summary:
- Total Webinars Reviewed: 12
- Structural Validation (Exact): 8
- Partial Validation: 2
- Invalid Forecasts: 2
- Publicly Documented Forecasts: 12/12
- Total Structured Opportunity Range: 800+ Points
- Forecast Success Ratio = 66% Exact + 16% Partial
- Total Valid Structure = 83% (Exact + Partial)
This is not a filtered performance summary.
It is the complete sequence — including weeks that validated, partially validated, and weeks that did not trigger projected levels.
Important Clarification
Not every projected movement was traded.
Some weeks served as structural validation rather than executed trades.
Trade execution depended on confirmation and predefined risk parameters.
The purpose of this study is to evaluate forecasting consistency — not to claim guaranteed profits.
Week-by-Week Breakdown
Now let’s walk through each week briefly — what was projected, and how the market responded.
Week 1 – Structural Projection & Validation
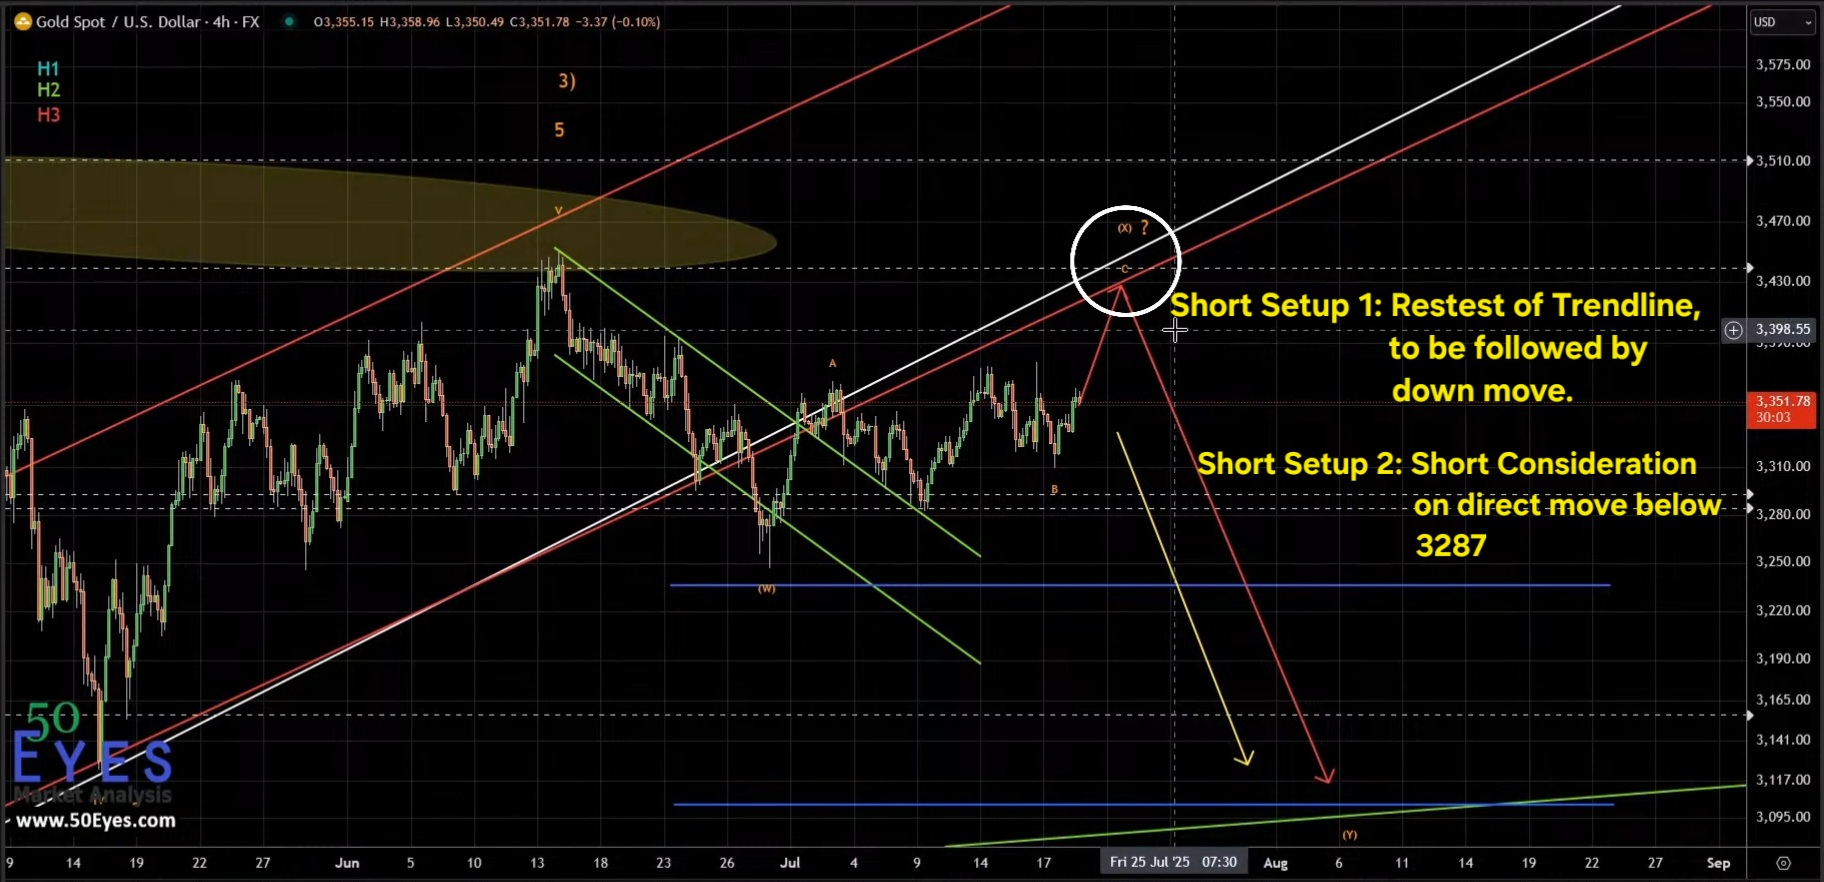
During this webinar, gold was discussed in detail within a rising channel structure. The projection outlined two expectations — an upside move toward channel resistance, followed by a corrective decline.
🎥 Watch the Forecast Discussion Week 1 – Breakdown Confirmation from Trendline Retest
In the public webinar, gold was analyzed with a clear bearish hypothesis based on market structure and trendline behavior.
The focus was on a short trade setup, with two key expectations:
- 👉 A retest of the descending trendline, followed by rejection
- 👉 A decisive move below 3287, confirming downside continuation
🎥 Webinar Reference
GOLD short trade setup, re testing trendline or go below 3287
At the time of discussion, price was approaching the trendline resistance zone, making it a critical decision area. The structure suggested that if sellers defended this region, the market would likely resume its downward move.
In the following sessions, price respected the trendline perfectly, delivering a clean rejection and then breaking below the 3287 level, confirming the bearish continuation exactly as anticipated.
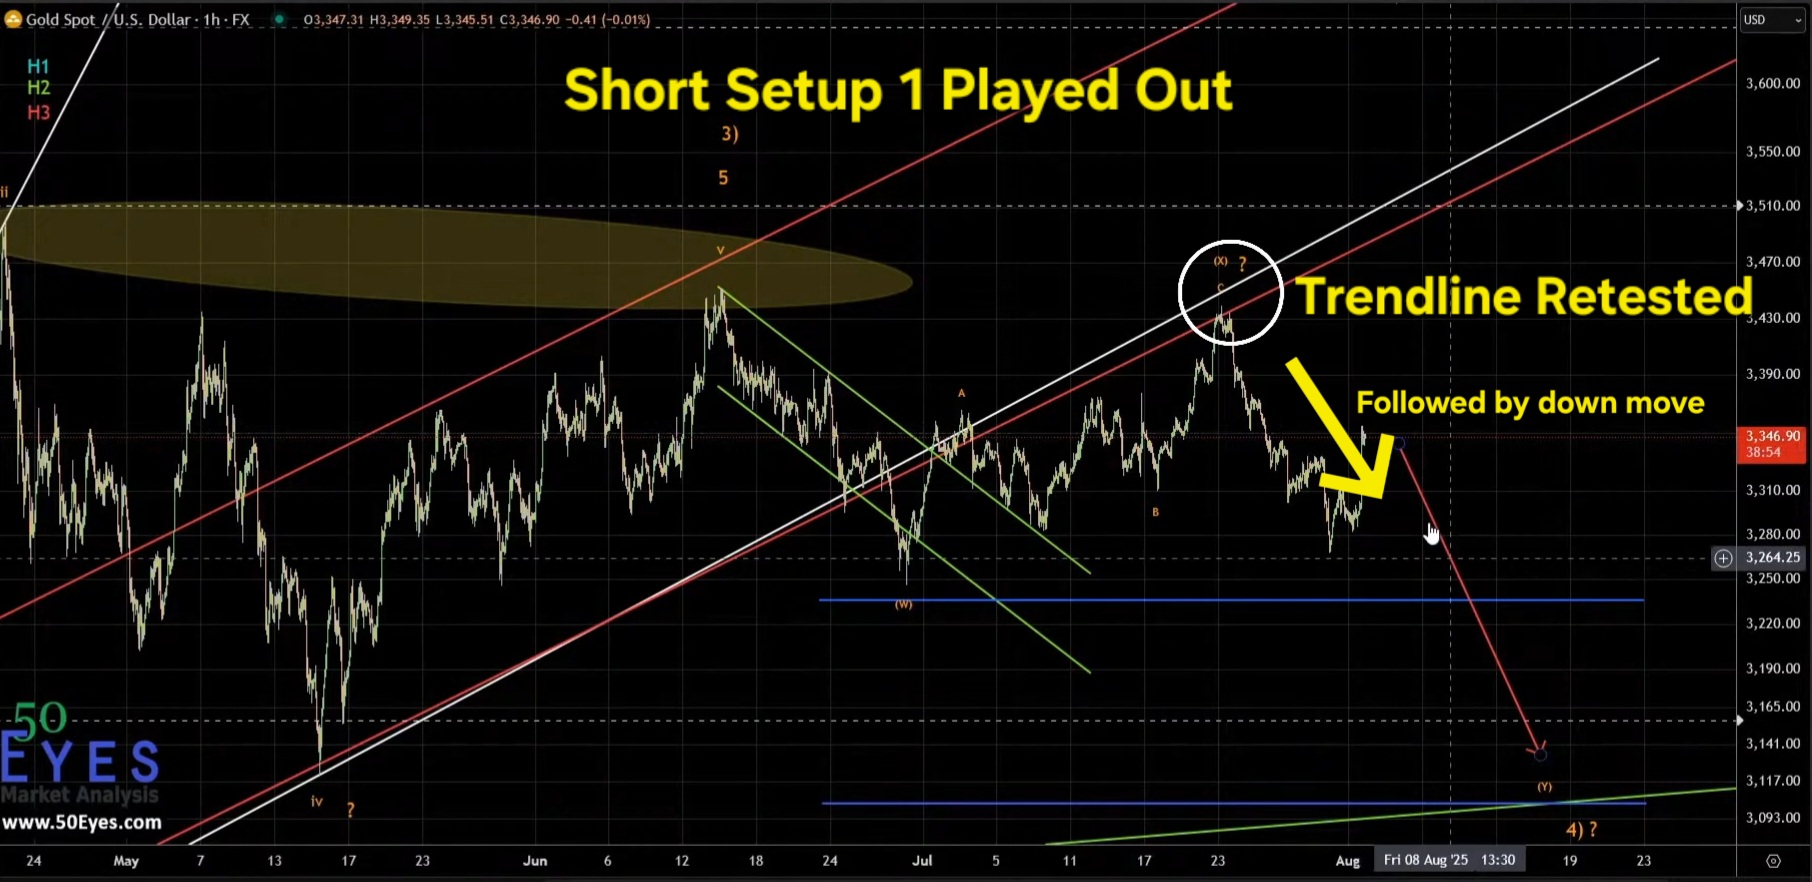
GOLD short trade setup played out retested trendline
Summary:
- ✔ Primary Bias: Bearish
- ✔ Key Level: 3287
- ✔ Setup Type: Trendline Retest
- ✔ Trigger Hit: Yes
- ✔ Final Direction: Bearish
- ✔ Outcome: ✔ Direct Forecast Validation
This week highlights a core strength of the methodology:
alignment between structure and execution.
The market followed the projected path without requiring any conditional shift — respecting both the trendline resistance and the breakdown level with precision.
This is recorded as a direct forecast success, where both the setup and execution unfolded exactly as outlined in the initial analysis.
🎥 Watch the Forecast Discussion (Week 2 Webinar)
In this week, gold was assessed with a bearish continuation outlook, with focus on a developing breakdown structure near a critical level.
The core hypothesis was clear:
short consideration below 3311, only upon a confirmed breakdown.
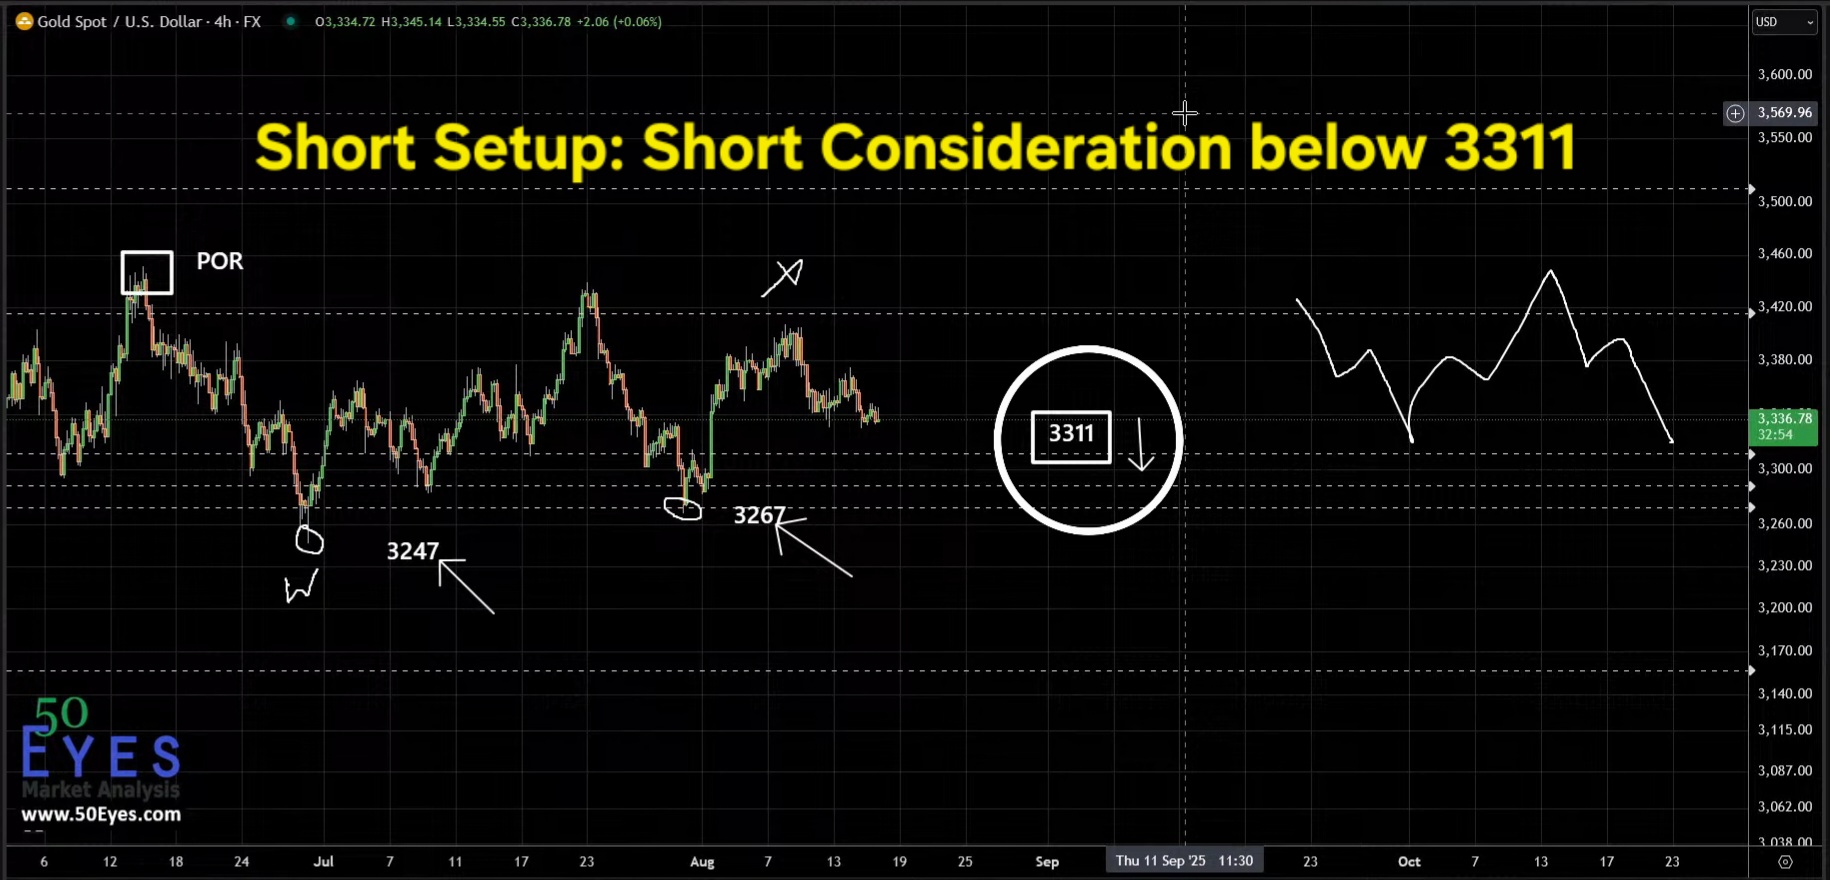
GOLD short trade setup below 3311
At the time of discussion, price was approaching the 3311 level, identified as a key support zone. A decisive break below this level was expected to confirm downside continuation and activate short-side opportunities.
However, in the sessions that followed, the market did not break below 3311.
Instead, price held the level and moved sideways, maintaining equilibrium without confirming either direction.
This meant the short setup remained valid but untriggered, as the required breakdown condition was never met.
Summary:
- ✔ Primary Bias: Bearish
- ✔ Key Level: 3311
- ✔ Setup Type: Breakdown
- ❌ Trigger Hit: No
- ✔ Market Behavior: Sideways Consolidation
- ⏳ Outcome: ⏳ Setup Active (Awaiting Confirmation)
This week highlights a critical principle of structured trading:
patience during non-confirmation phases.
The level was respected, the condition was clear, and without a confirmed breakdown, no trade was executed. Rather than forcing entries, the approach allowed the market to develop further.
👉 The structure remained intact, and the setup stayed in play — leading us into the next week for potential follow-through.
🎥 Watch the Forecast Discussion Week 3 – Conditional Bias Confirmed
In the public webinar, gold was assessed with a primary bearish expectation, while maintaining a level-dependent approach to market structure.
The core hypotheses were clearly defined:
- 👉 Long Setup: Long consideration above 3405+
- 👉 Short Setup 2: Short consideration below 3311
🎥Video discussing the analysis
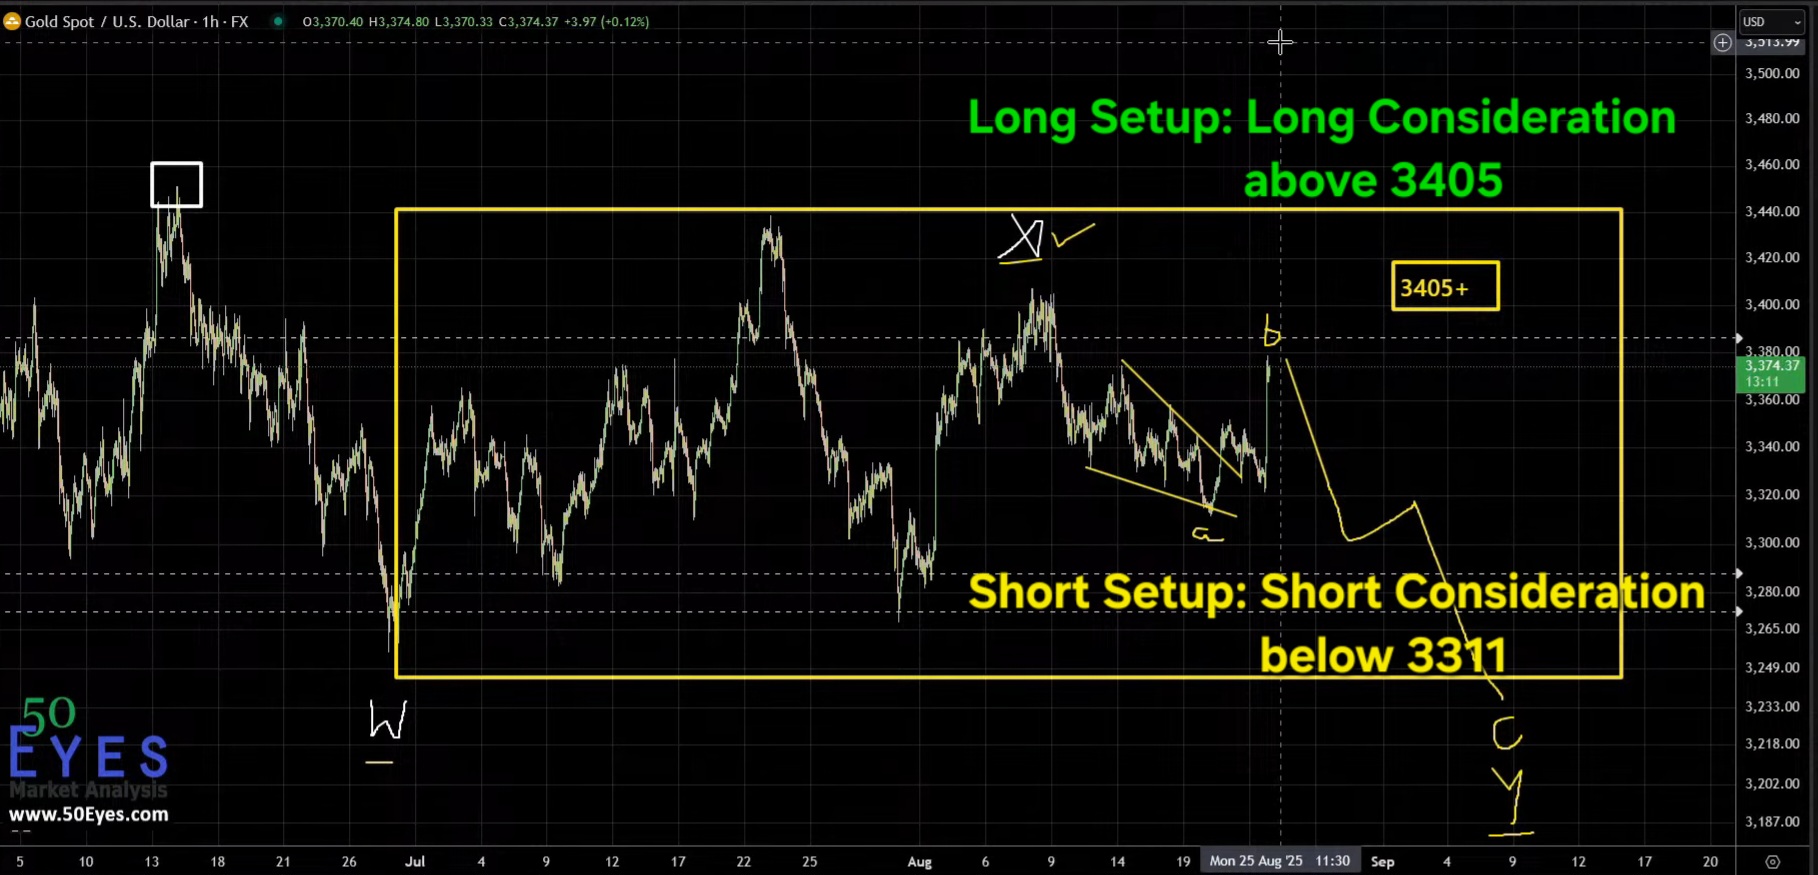
GOLD short consideration below 3311
At the time of discussion, price was trading below the 3405 resistance zone, keeping the bearish structure valid, while both conditional pathways remained active.
During the following sessions, price advanced and decisively moved above 3405, triggering the predefined bullish scenario. This confirmed the long setup, while the alternate short consideration below 3311 never came into play.
As a result, the long setup played out, with price continuing higher after the breakout.
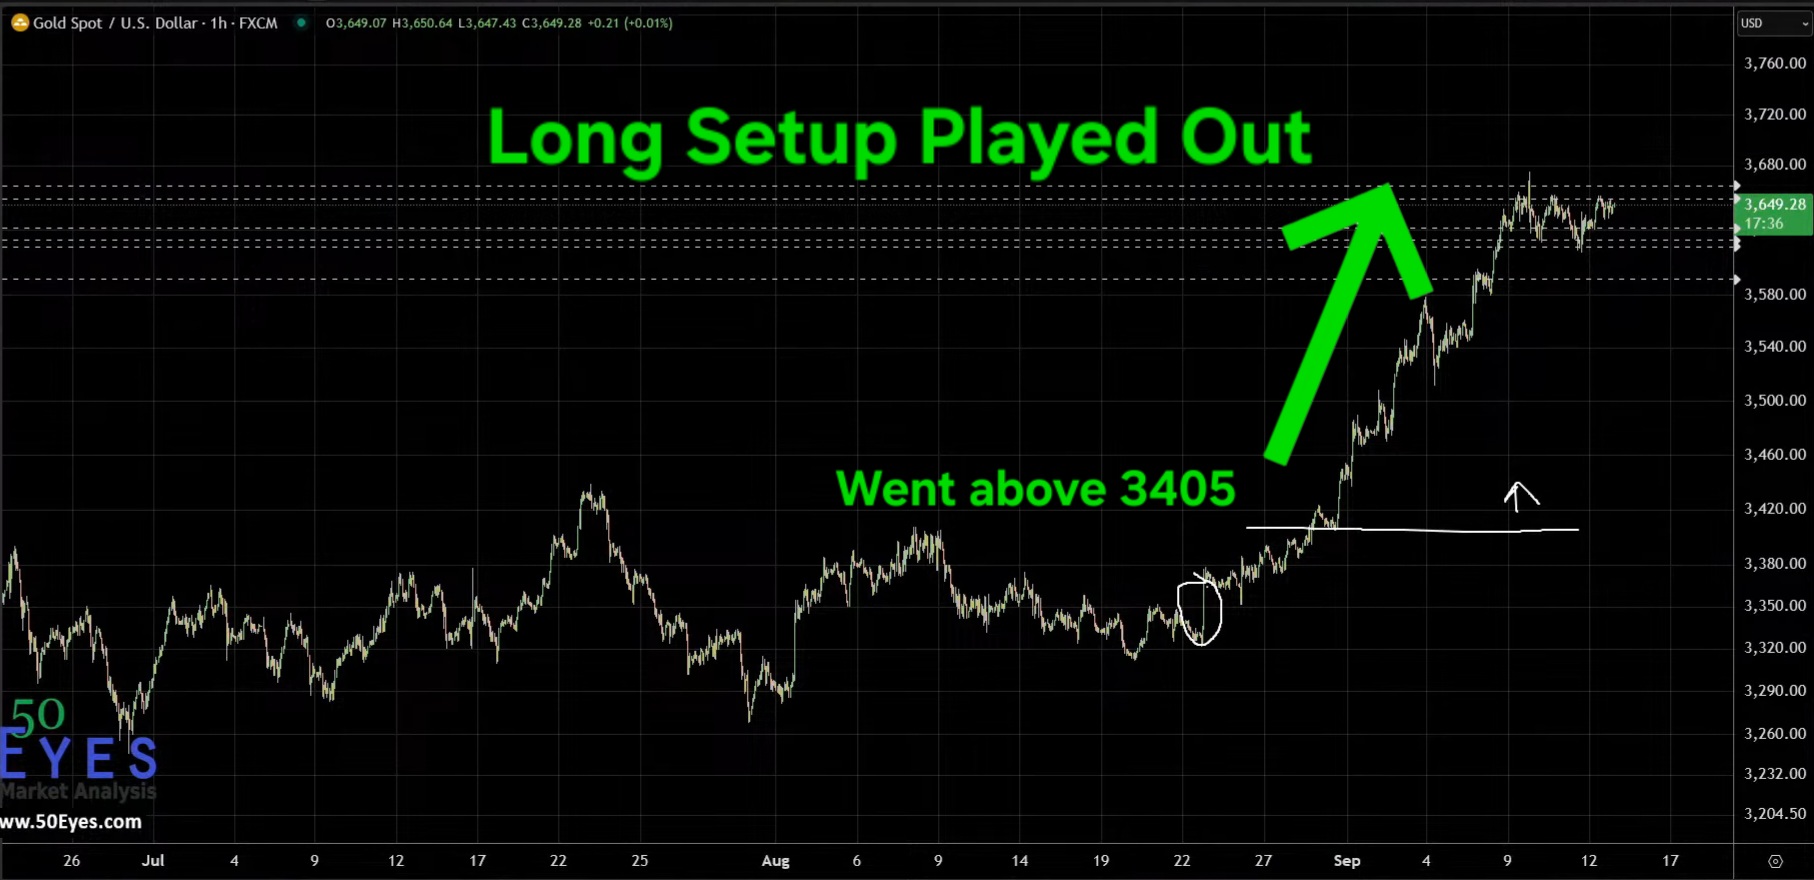
GOLD long trade setup played out went above 3405
Summary:
- ✔ Primary Bias: Bearish
- ✔ Conditional Levels: 3405+ / 3311
- ✔ Trigger Hit: Yes (3405+)
- ✔ Final Direction: Bullish
- ✔ Outcome: ✔ Conditional Bias Confirmed
This week highlights a key strength of the methodology:
flexibility within structure.
The forecast was not fixed to a single direction — it was level-dependent and scenario-driven. Once price crossed the defined threshold, bias shifted exactly as planned, and the market followed through accordingly.
👉 The long setup played out as anticipated, while the short pathway remained inactive — reinforcing the importance of waiting for confirmed triggers over assumptions.
🎥 Watch the Forecast Discussion Week 4 – Upside Trigger Executed
Two scenarios were discussed:
- 👉 Upside continuation above 3656+
- 👉 Or immediate downside leg
🎥 Watch the Webinar Discussion (12th September)
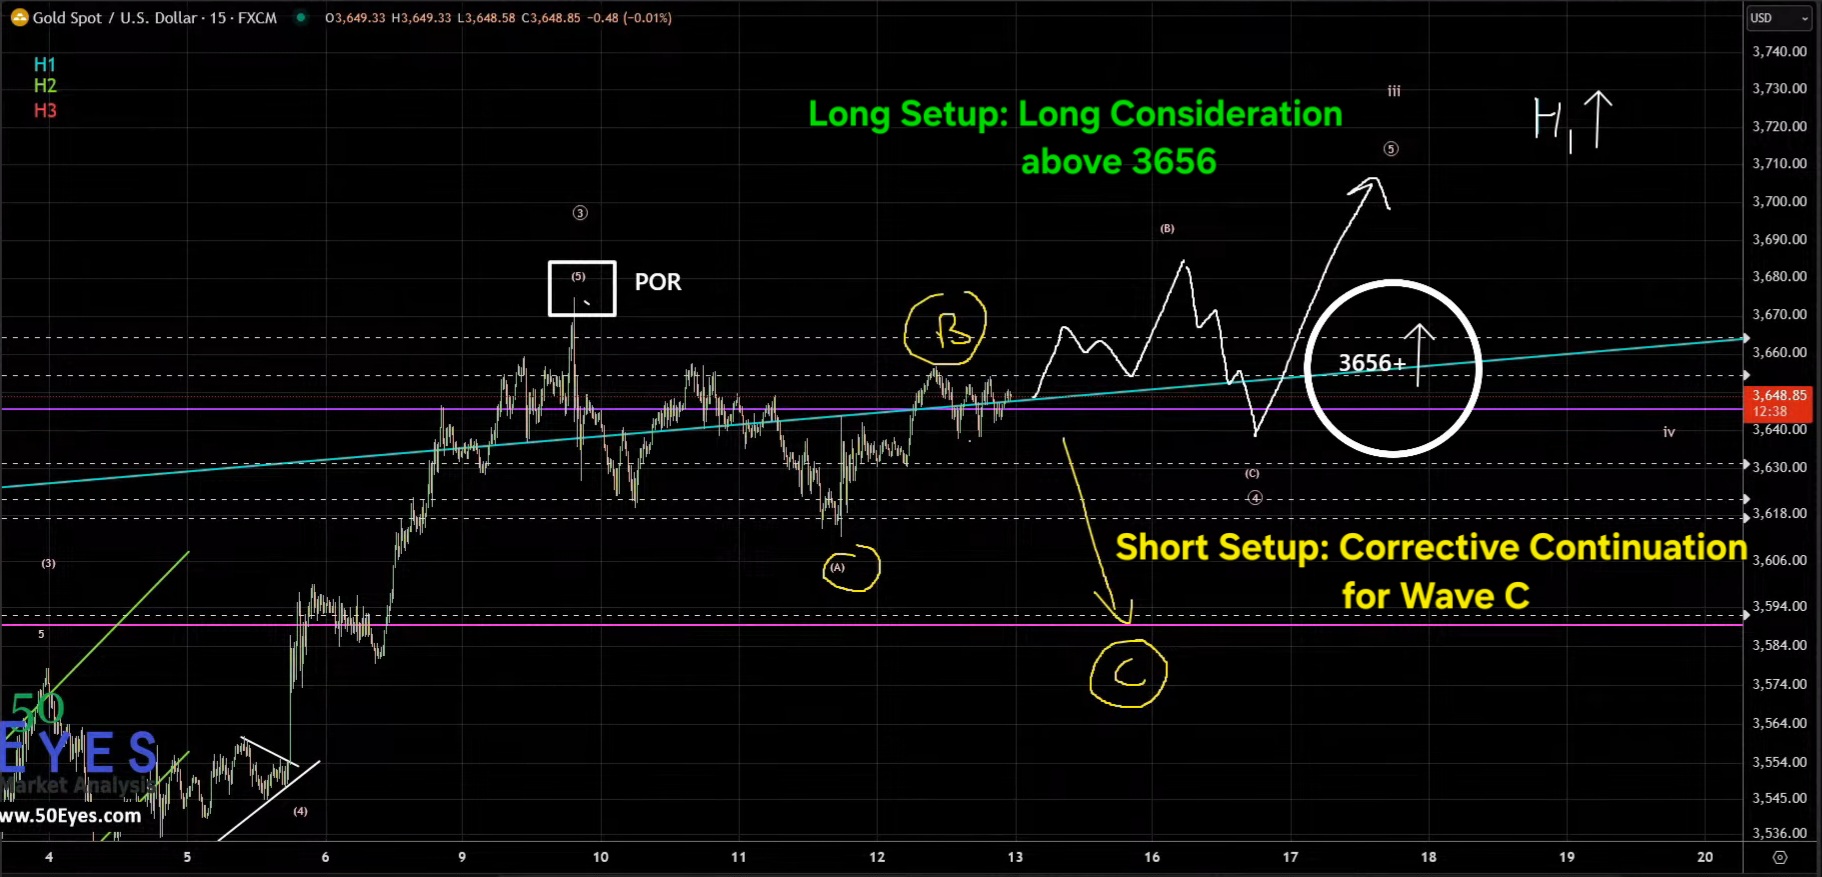
GOLD long trade consideration above 3656.
Price initially produced a deceptive downside move, suggesting the short setup might trigger. However, the market reversed, broke 3656+, and activated the long scenario.
GOLD long setup played out – 50 points move
Price then advanced into the projected resistance zone as expected.
Summary:
- ✔ Trigger Level: 3656+
- ✔ Trigger Hit: Yes
- ✔ False Move Observed: Yes
- ✔ Resistance Target: Hit
- ✔ Outcome: ✔ Successful Trigger Activation
Clean trigger. Confirmed level. Structured follow-through.
📈 Pattern Insight
After the first four weeks, a clear behavioral pattern begins to emerge:
- ✔ Markets respected predefined trigger levels
- ✔ False moves occurred before real direction (Week 4)
- ✔ Conditional bias (Week 3) proved more reliable than fixed predictions
👉 Key Insight:
|The market did not reward prediction — it rewarded reaction to levels.|
🎥 Watch the Forecast Discussion Week 5
In this webinar, two possibilities were discussed:
- 👉 Breakout long above 3695+
- 👉 Or one leg down before upside continuation
🎥 Watch the Webinar Discussion (Week 5)
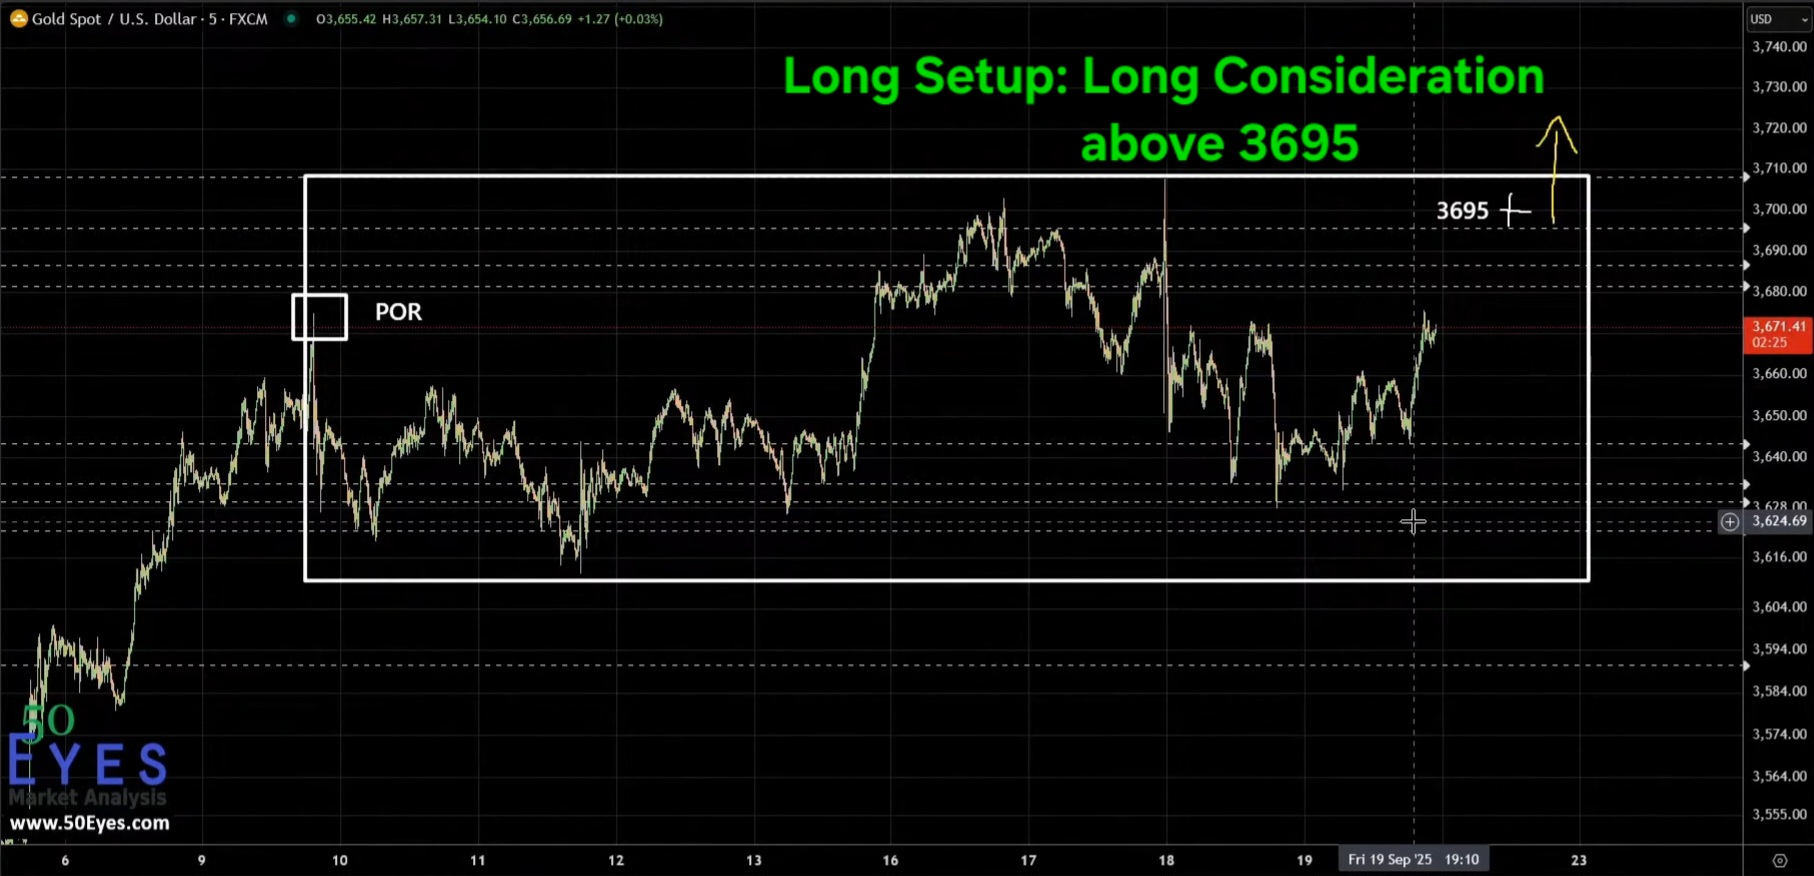
GOLD long consideration above 3695
During the week, price decisively moved above 3695, activating the breakout scenario. The market then continued higher and made new highs.
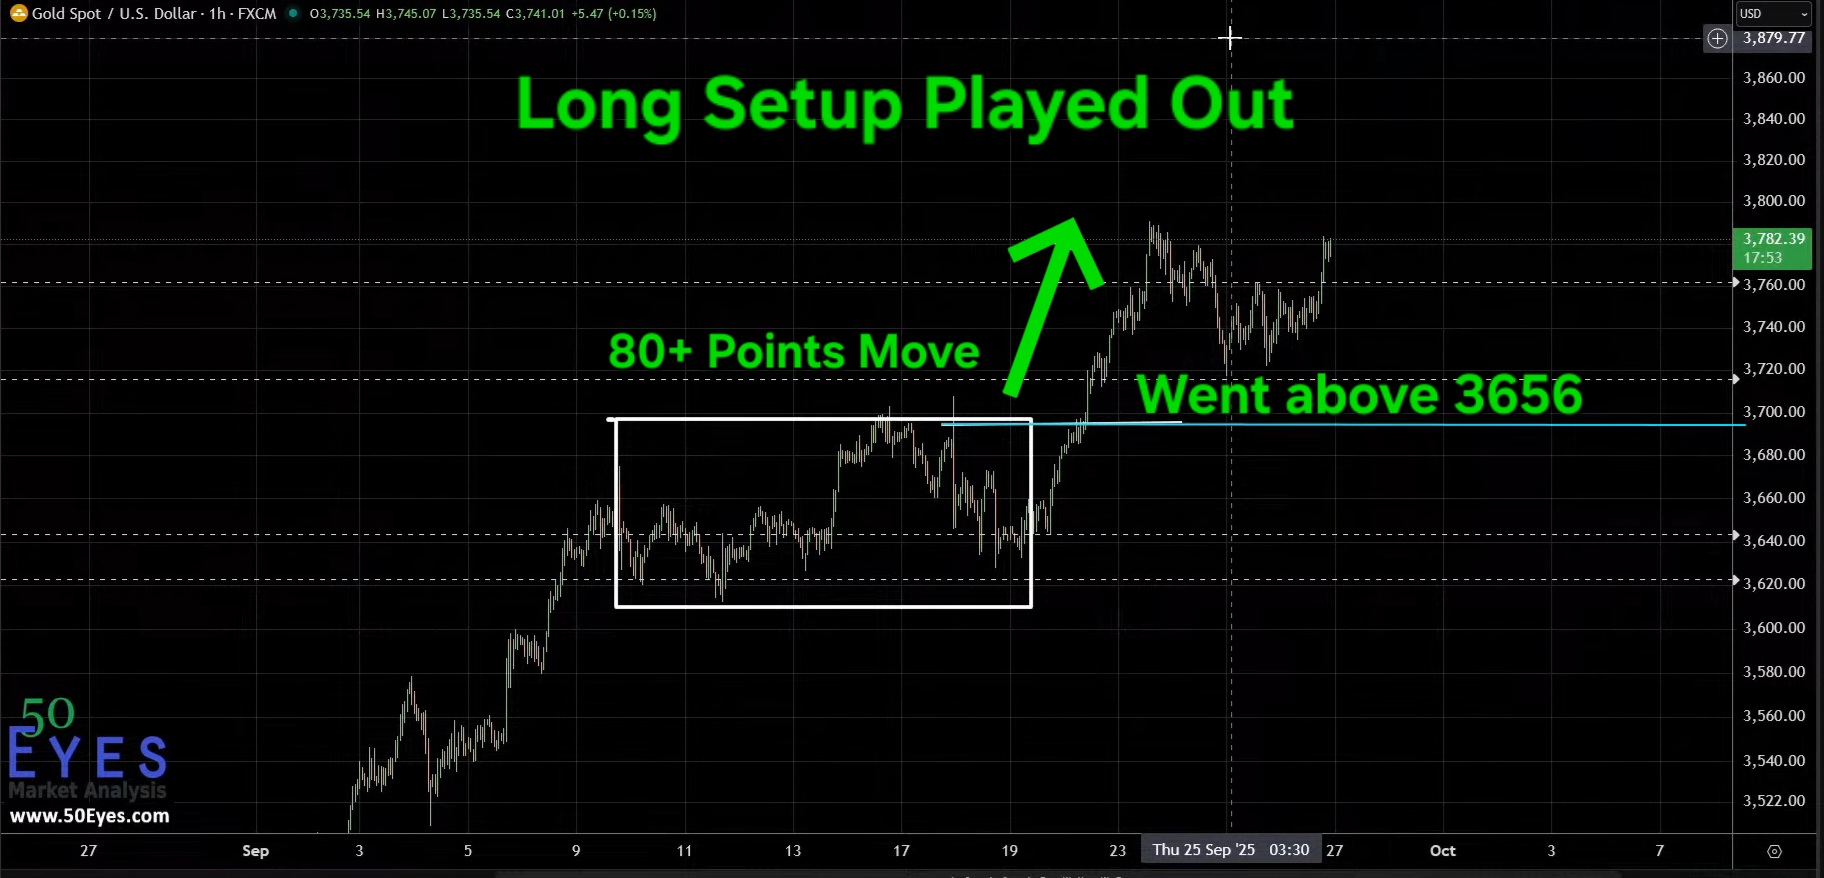
GOLD long setup played out, 80 points move
Price advanced from 3695 to 3778, delivering 80+ points (approx. 2.3% move) as recorded in the spreadsheet.
Summary:
- ✔ Trigger Level: 3695+
- ✔ Trigger Hit: Yes
- ✔ Move Achieved: 3695 → 3778
- ✔ Points Captured: 80+
- ✔ Outcome: ✔ Breakout Validation
A clean breakout setup — activated by level, confirmed by momentum.
🎥 Watch the Forecast Discussion Week 6
In this discussion, an upside impulse in Wave 5 was projected with a target around 3870–3875, based on trendline intersection and structural count.
🎥 Watch the Forecast Discussion (Week 6 Webinar)
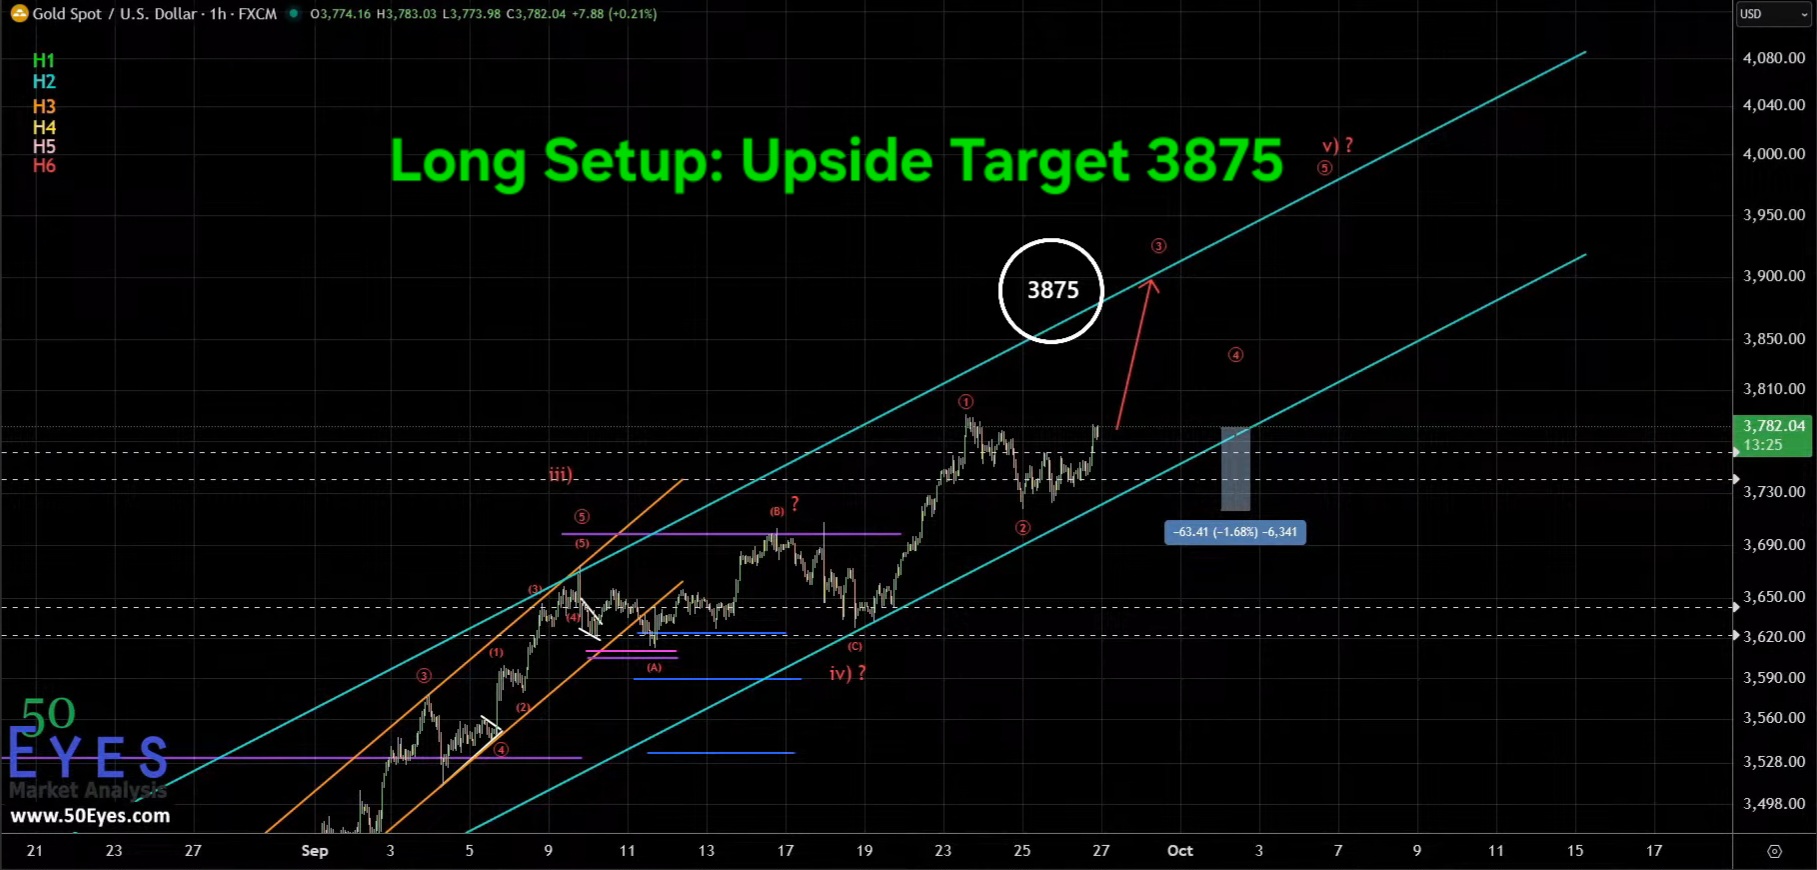
GOLD long trade setup from target 3875
During the following sessions, price advanced strongly, reached the 3870–3875 region, briefly pulled back, and even surpassed the projected zone before moving sideways.
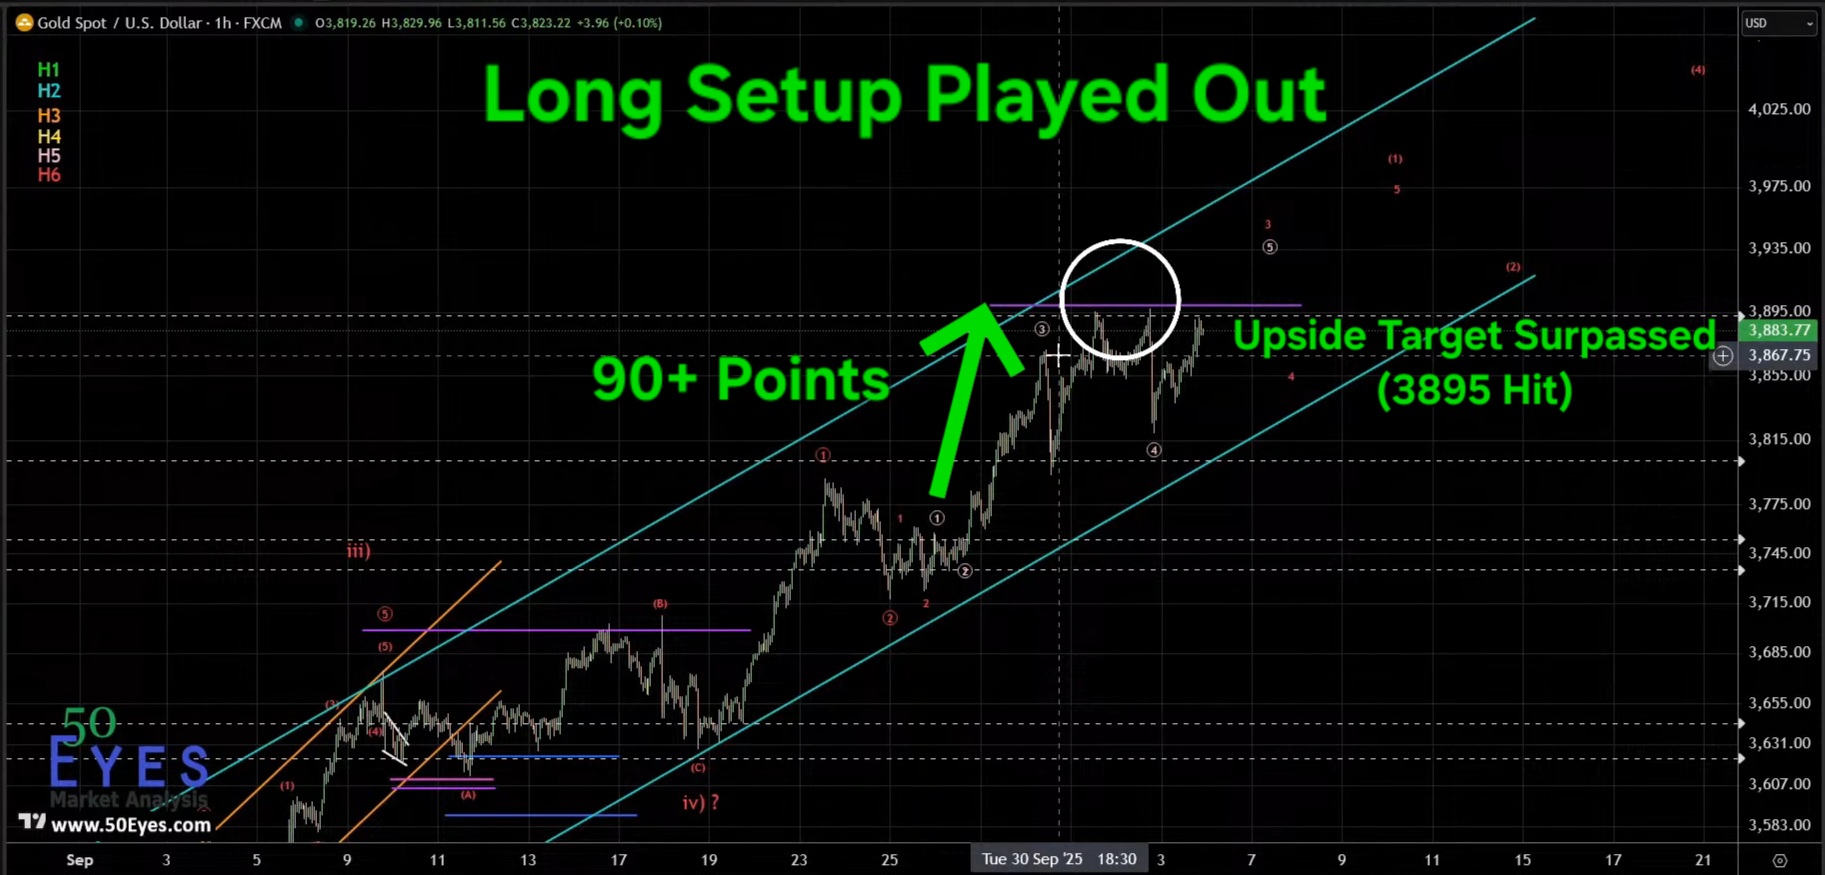
GOLD long trade setup played out. Surpassed all upside targets – 90 points move
Summary:
- ✔ Projected Target: 3870–3875
- ✔ Target Hit: Yes
- ✔ Target Exceeded: Yes
- ✔ Points Captured (as per sheet): 90 points
- ✔ Outcome: ✔ Target Validation
A projected impulse move — executed into the defined resistance zone with structural precision.
📊 Week 7 – Target Achieved with Momentum Extension
🎥 Watch the Forecast Discussion (Week 7 Webinar)
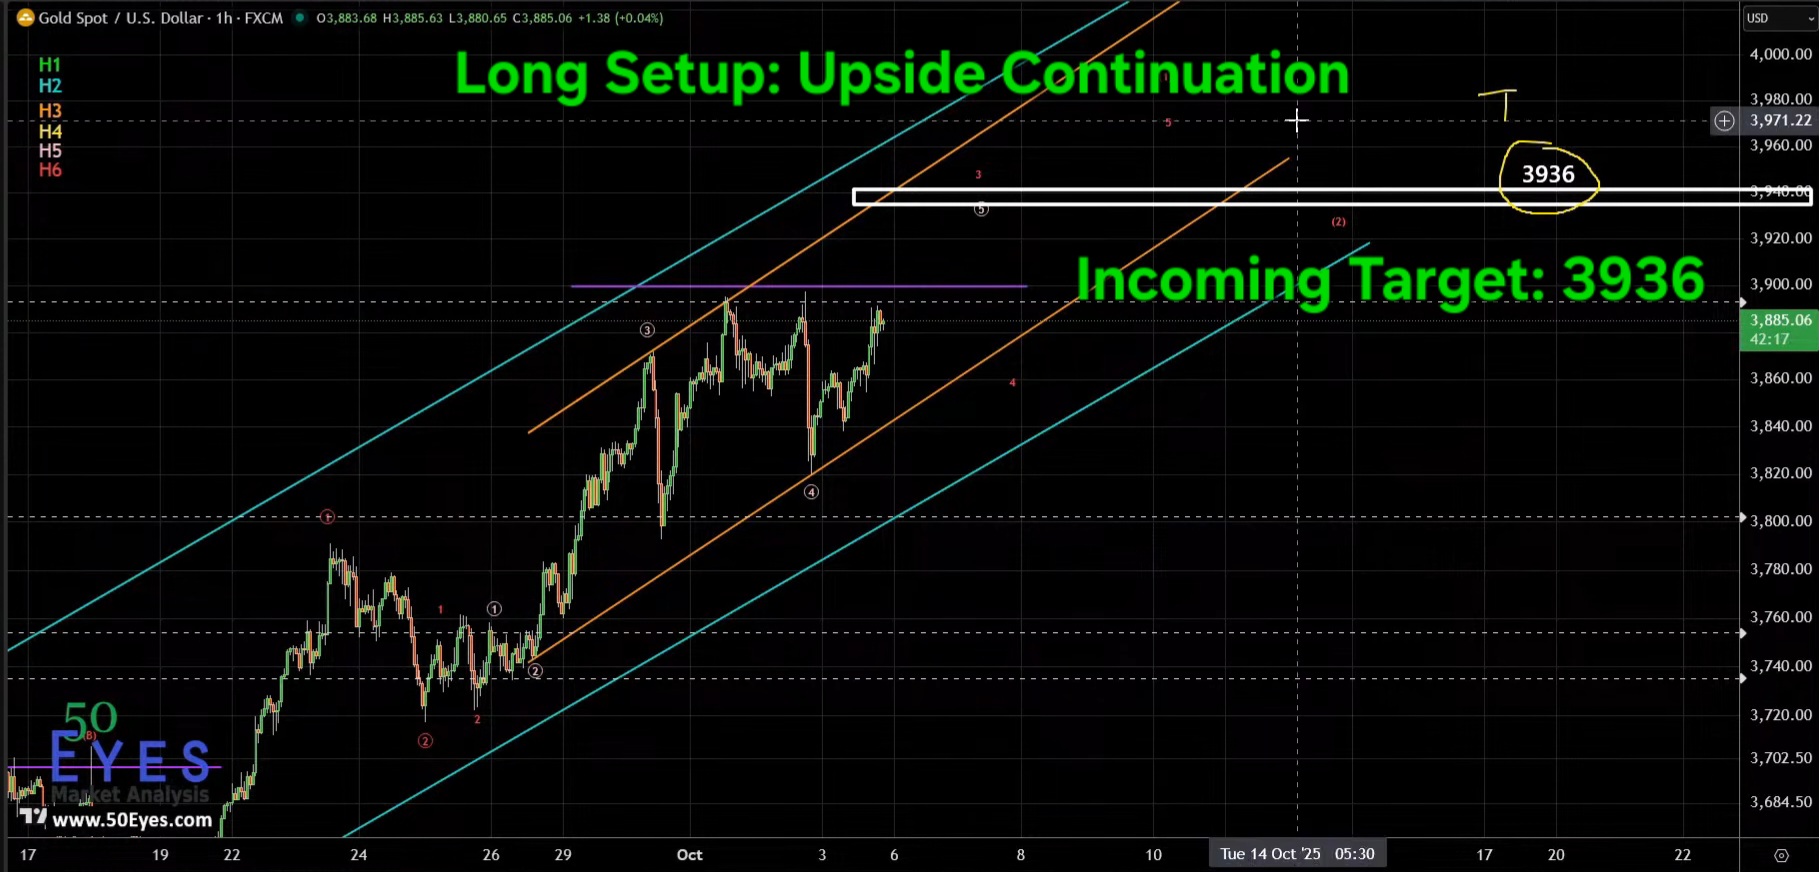
GOLD upside continuation for target 3936
In this session, gold was mapped with a clear breakout condition.
The level 3892+ was identified as the activation point for bullish continuation, with 3936 as the immediate upside objective.
Once the market moved above the trigger zone, momentum followed through without hesitation.
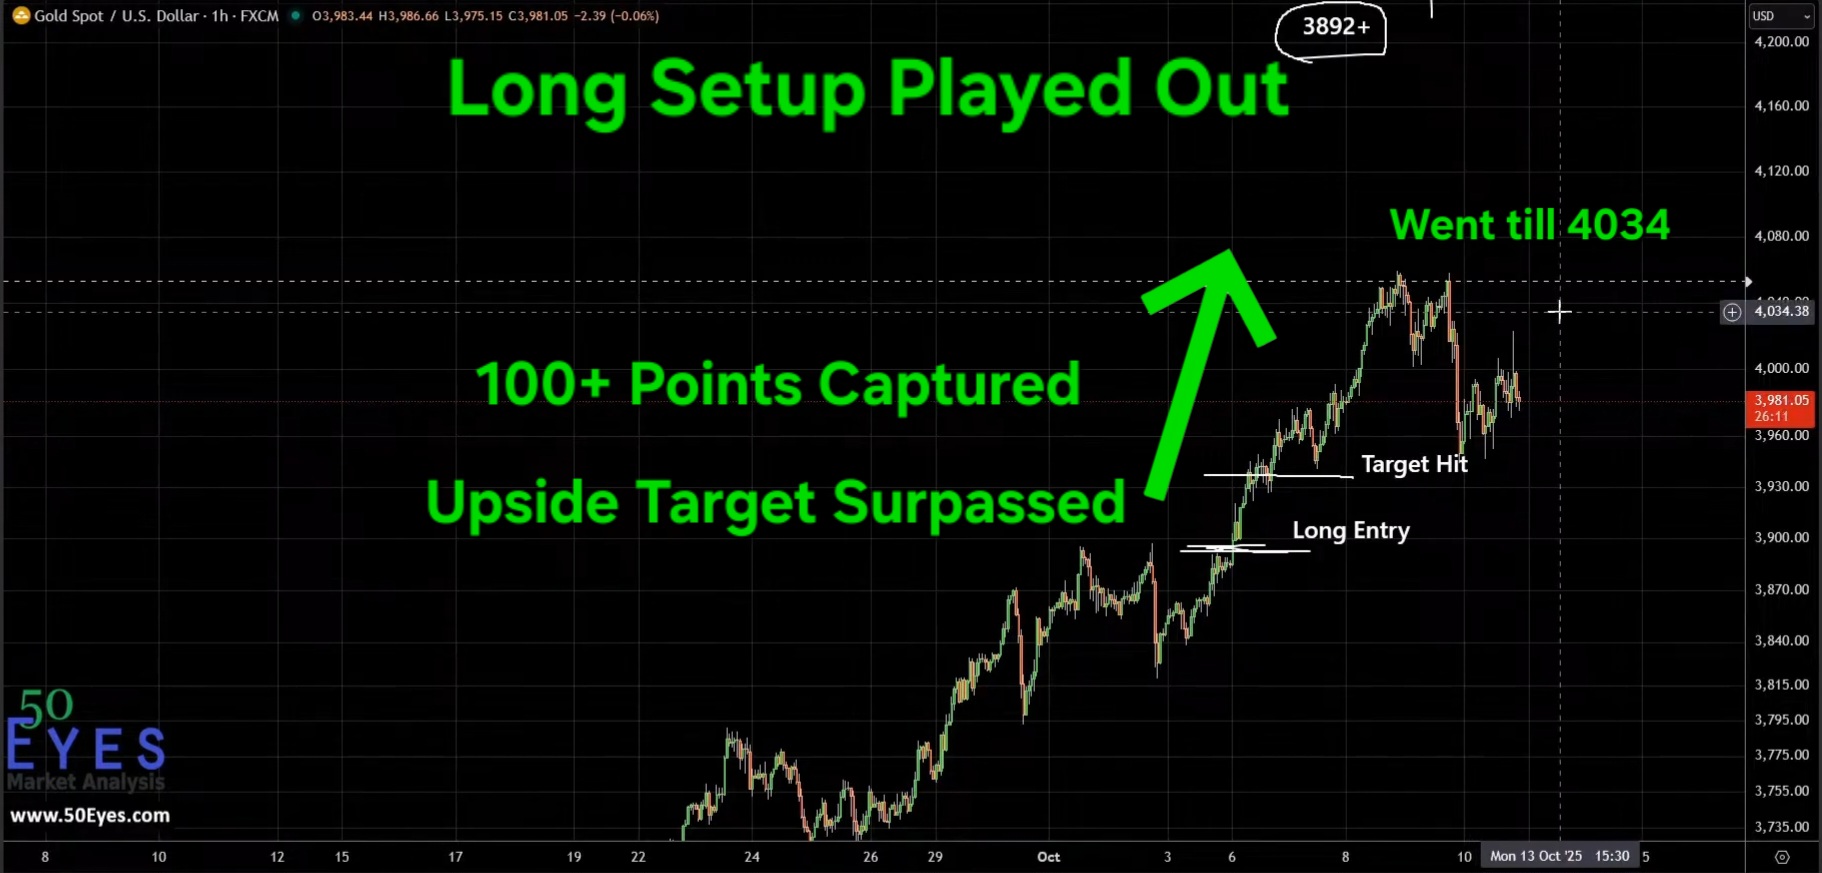
GOLD long trade setup played out capturing 100 points
Price not only reached the projected 3936 level but extended further, approaching the psychological 4000 mark — indicating strong trend continuation beyond the base projection.
Summary:
- ✔ Trigger Level: 3892+
- ✔ Trigger Hit: Yes
- ✔ Target: 3936
- ✔ Extension: Beyond 4000
- ✔ Points Captured: 100+
- ✔ Outcome: ✔ Target Achieved with Extension
A structured breakout — followed by sustained momentum.
If you want to understand:
- Complete Elliott Wave roadmap
- Full trade planning process
- Entry & exit logic in detail
👉 Check the full case study here: Capturing 100 point on Gold
📊 Week 8 – Strong Breakout Confirmation
🎥 Watch the Forecast Discussion (Week 8 Webinar)
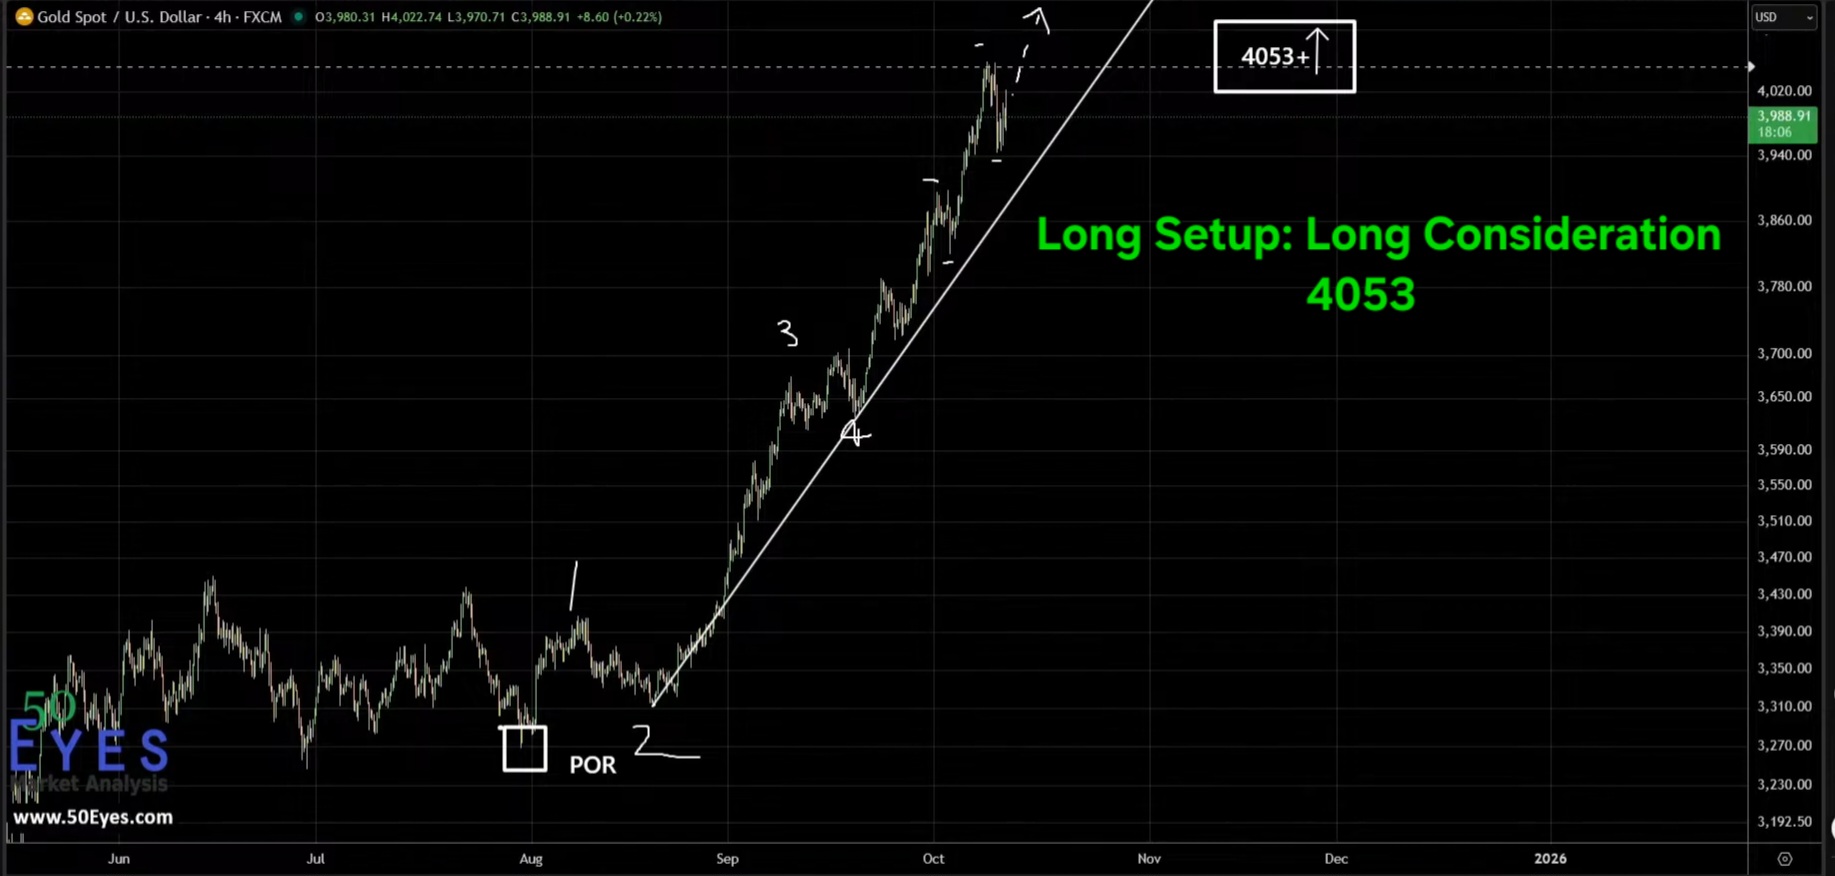
GOLD long trade setup above 4053
This week focused on a single decisive level: 4053+.
The outlook remained conditional — strength would only be confirmed above this zone.
Once triggered, the market delivered a sharp directional move.
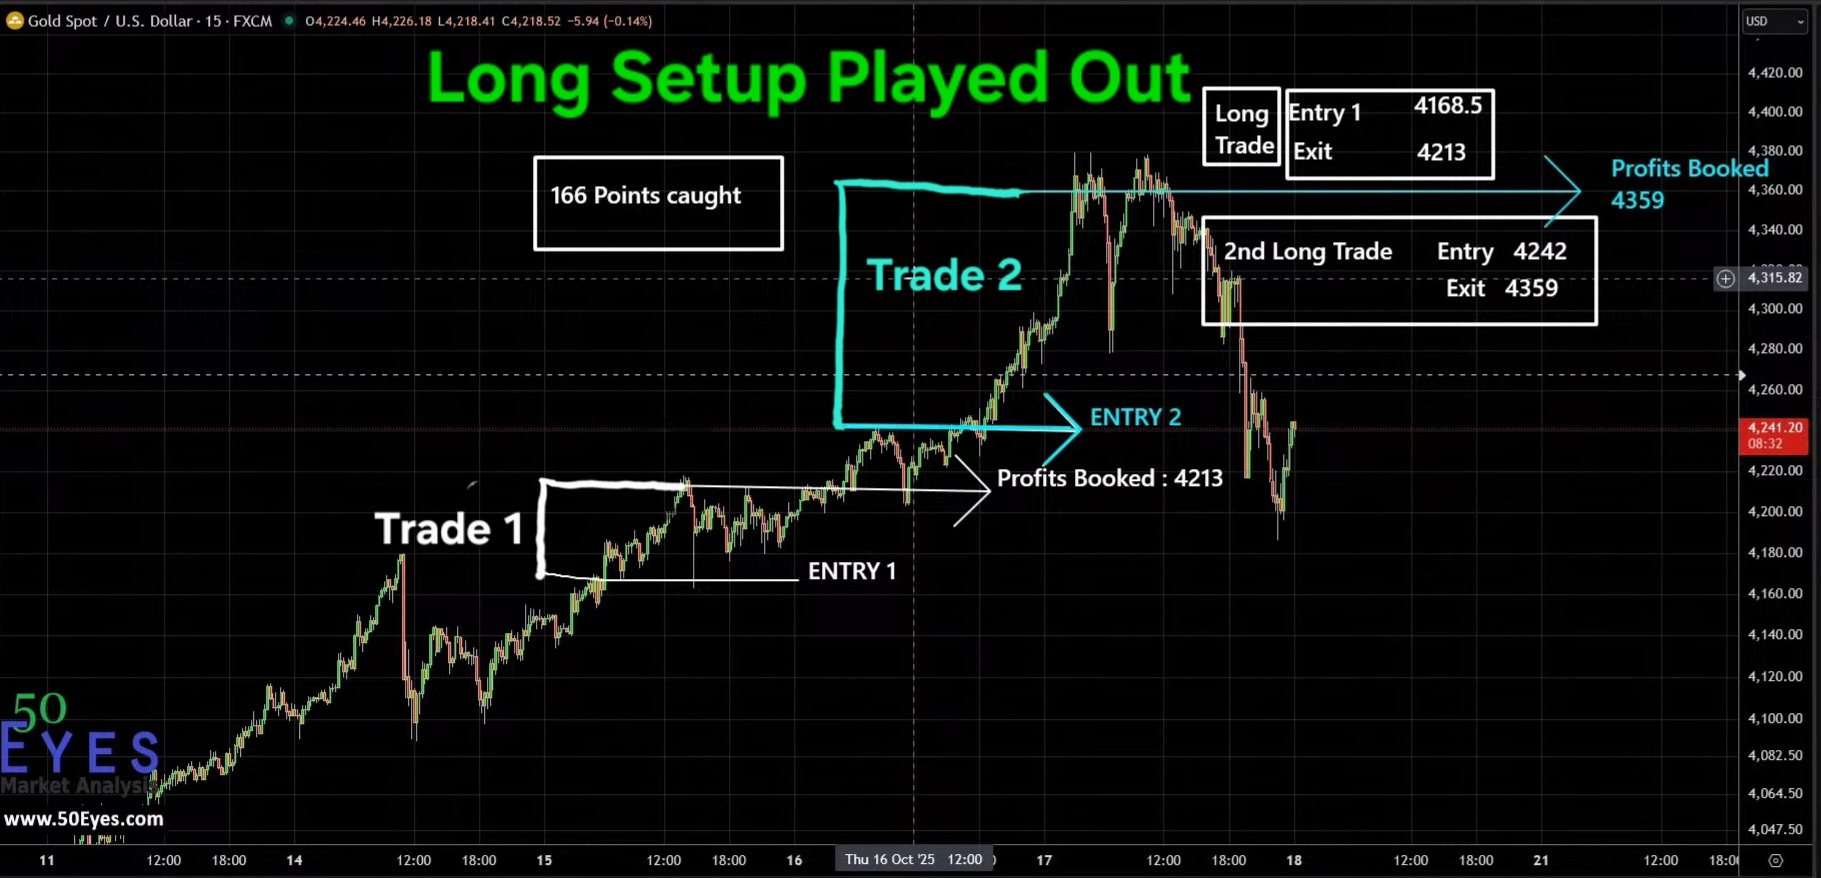
GOLD long setup played out captured 166 points illustrated on chart
Price accelerated quickly after breakout, offering both immediate and extended opportunities as momentum continued building through the week.
Summary:
- ✔ Trigger Level: 4053+
- ✔ Trigger Hit: Yes
- ✔ Initial Move: 116 Points
- ✔ Additional Expansion: ~50 Points
- ✔ Total Opportunity: 160+ Points
- ✔ Outcome: ✔ Strong Breakout Validation
Clear level. Clean trigger. Strong expansion.
If you want to understand:
- Complete Elliott Wave roadmap
- Full trade planning process
- Entry & exit logic in detail
👉 Check the full case study here: [Insert Internal Link to Full Gold Case Study Page]
📈 Pattern Insight (After Week 8)
At this stage, momentum behavior becomes more evident:
- ✔ Breakout levels (Week 5–8) delivered strongest moves
- ✔ Trend continuation performed better than reversal attempts
- ✔ Once triggered, moves extended beyond initial targets
👉 Key Insight:
Strong trends don’t just reach targets — they extend beyond expectations.
📊 Week 9 – Upside Projection Not Activated
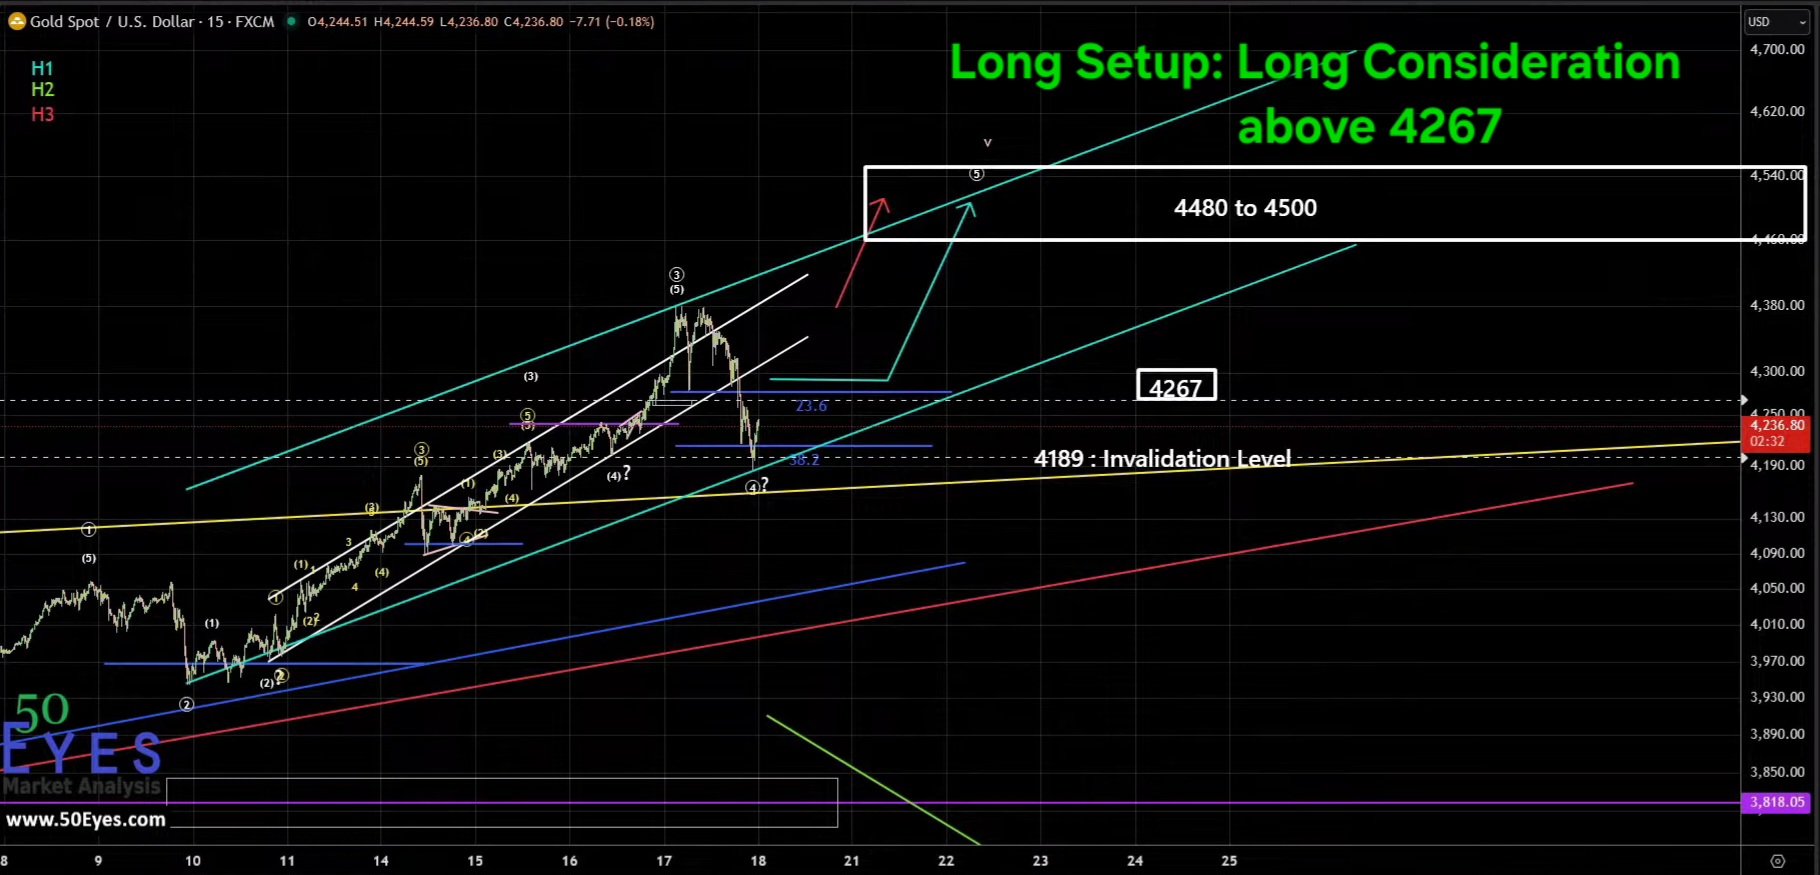
GOLD long consideration above 4267
The expectation for this week leaned toward continued upside, with projected targets around 4480–4500.
However, the market did not confirm strength.
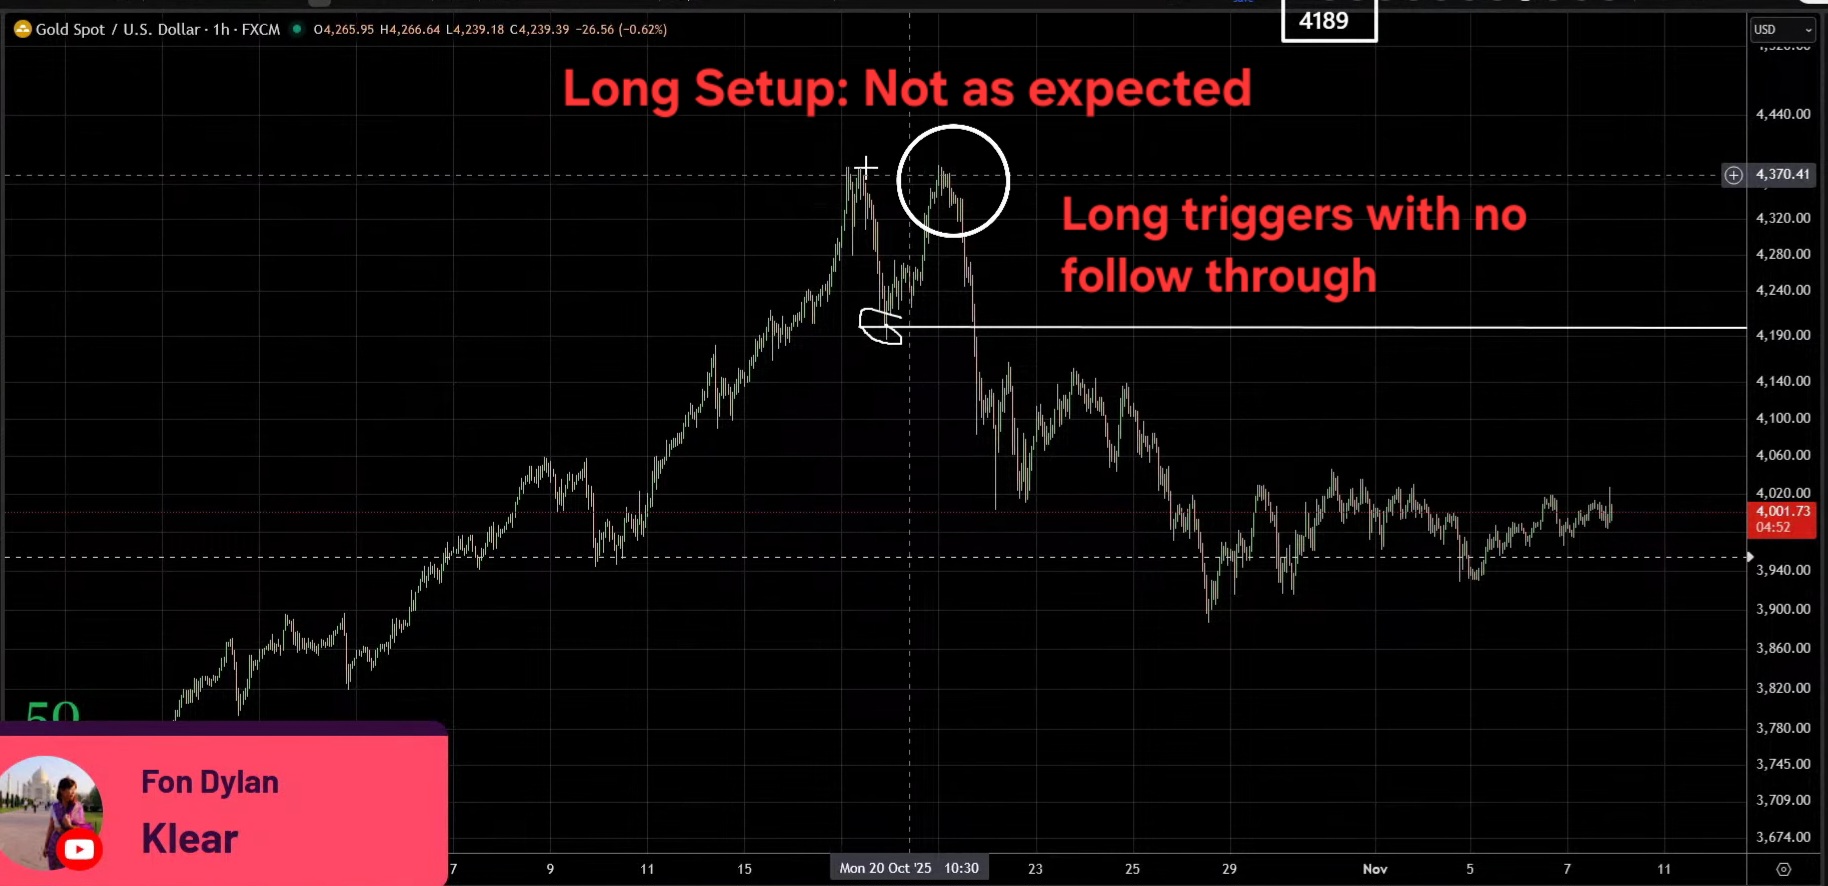
GOLD long setup not as expected
Price failed to sustain upward momentum and remained below the required continuation structure, preventing the projected move from materializing.
Summary:
- ✔ Projected Targets: 4480 / 4500
- ❌ Trigger Confirmation: No
- ❌ Targets Hit: No
- ❌ Outcome: Not as expected
Not every forecast converts into execution — and this is part of a complete evaluation.
📊 Week 10 – Conditional Breakout & Upside Follow-through
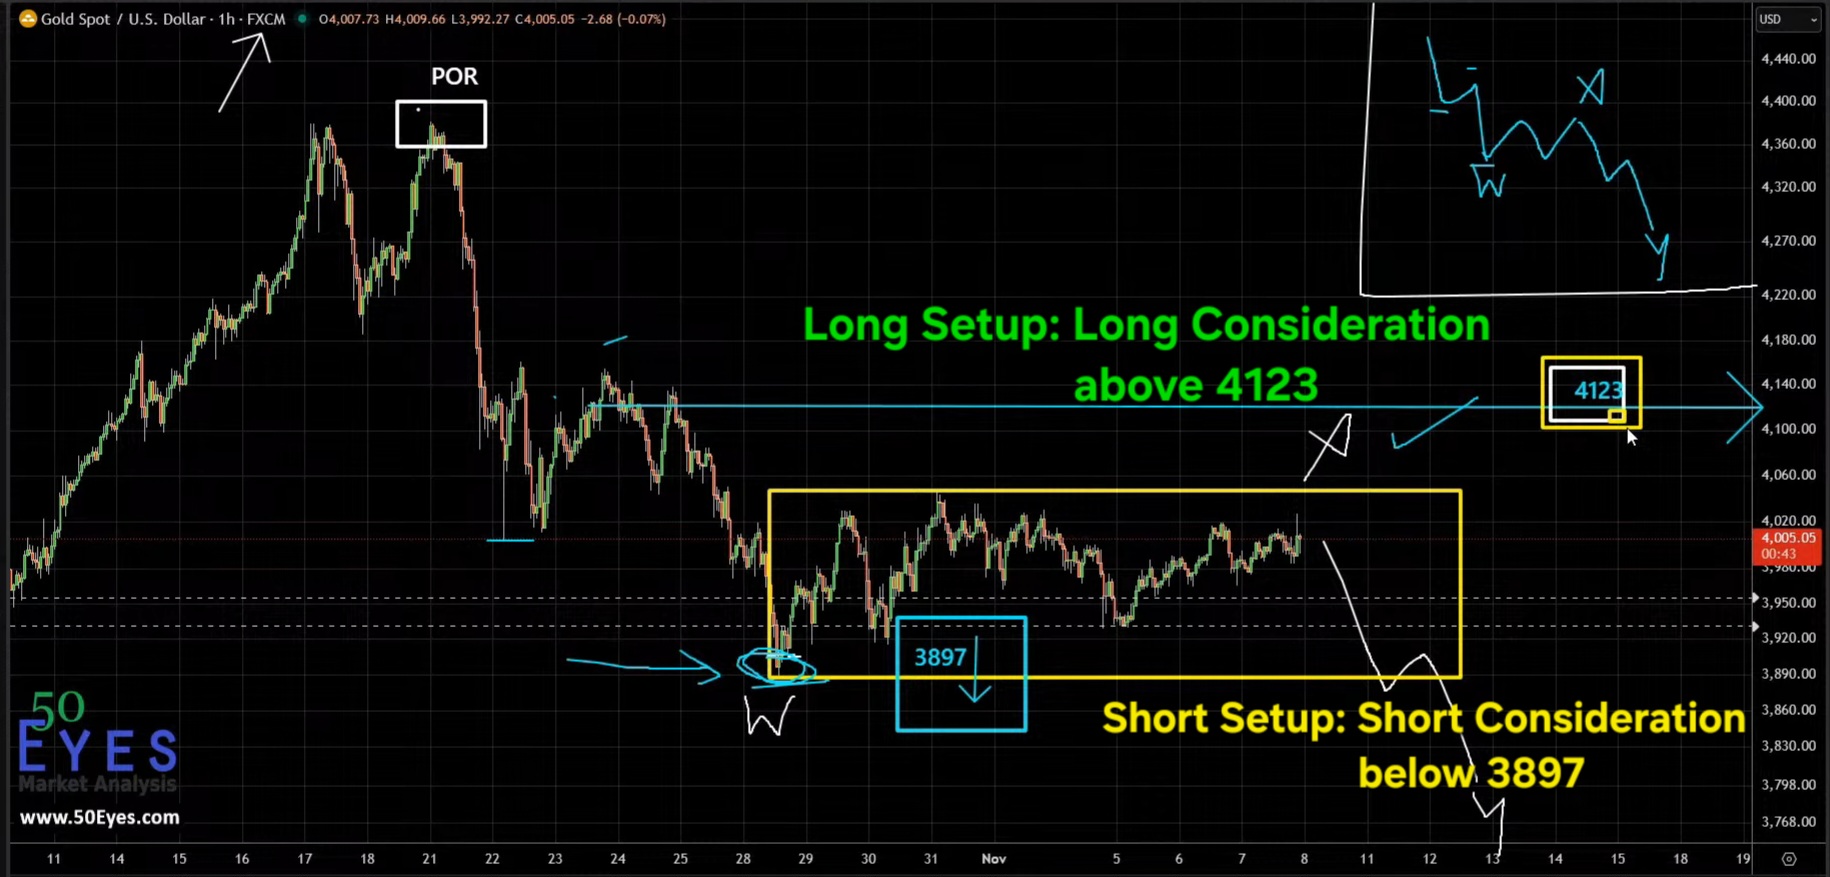
GOLD long trade setup above 4123
This week was approached with a level-dependent framework, outlining both directional possibilities based on key structural zones.
The hypotheses were clearly defined:
- 👉 Short Setup: Short consideration below 3897
- 👉 Long Setup: Long consideration above 4123
At the time of analysis, price was trading within this broader range, with both scenarios active and awaiting confirmation.
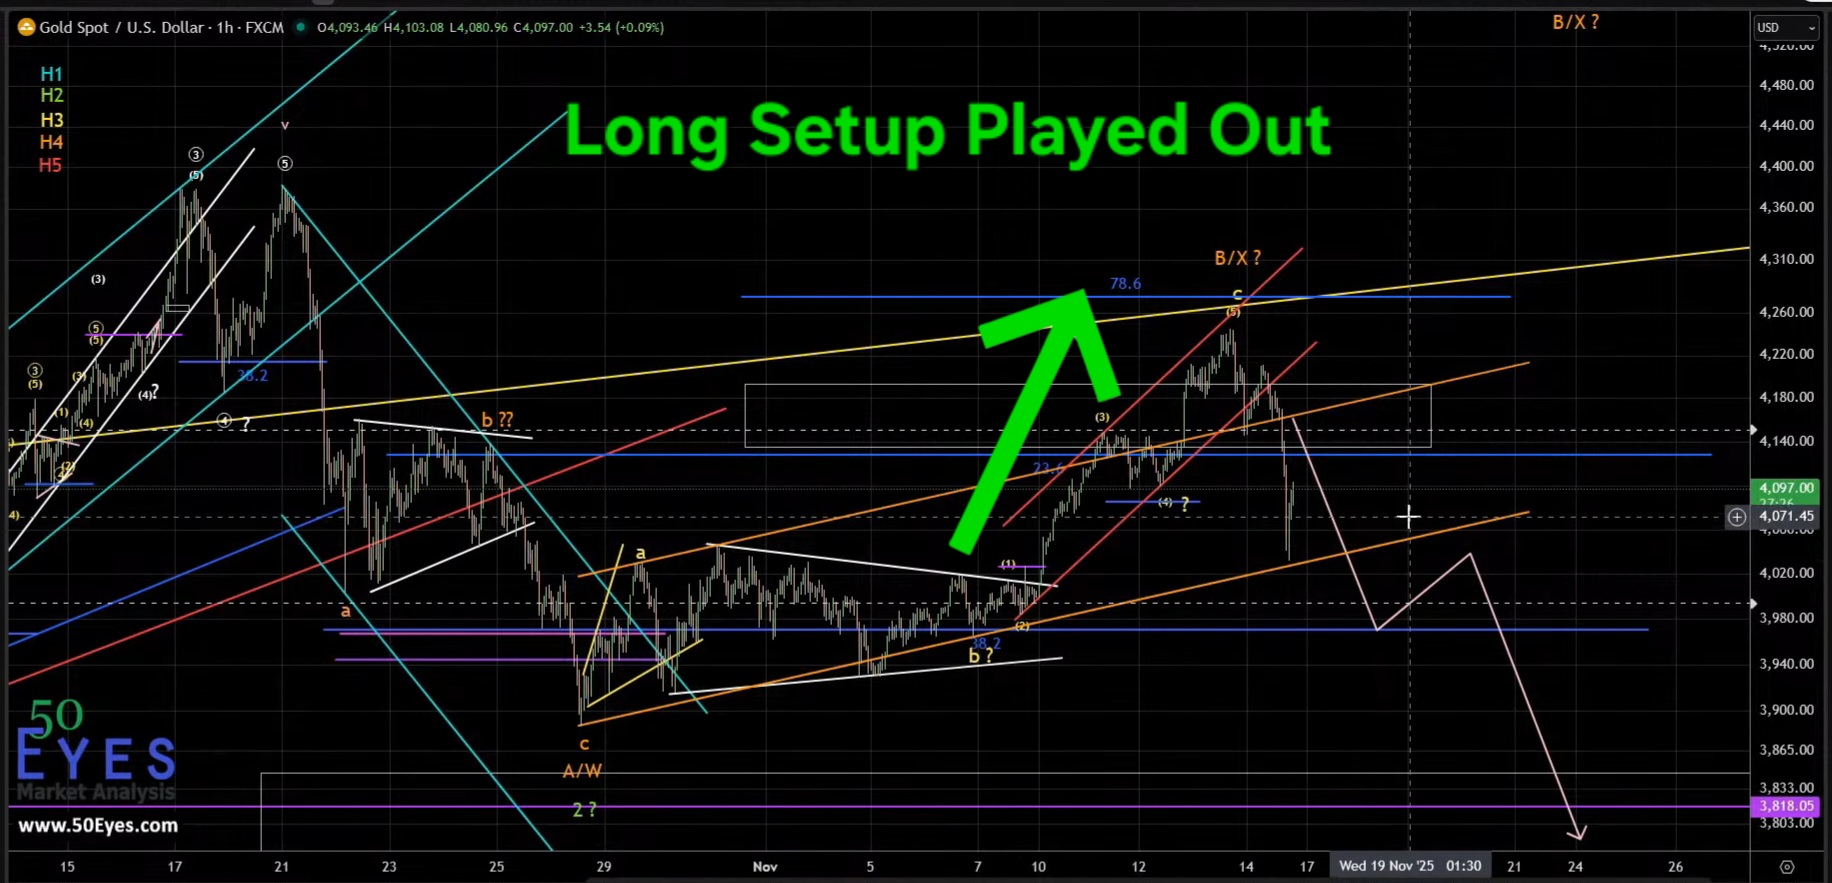
GOLD long setup played out
In the sessions that followed, price moved decisively above 4123, triggering the bullish pathway. This confirmed the long setup, leading to an upside move as anticipated.
Meanwhile, the short consideration below 3897 remained inactive, as price never approached the breakdown condition.
Summary:
- ✔ Key Levels: 3897 / 4123
- ✔ Trigger Hit: Yes (4123+)
- ✔ Final Direction: Bullish
- ✔ Market Behavior: Breakout & Continuation
- ✔ Outcome: ✔ Long Setup Played Out
This week reinforces the importance of a dual-scenario approach within structured analysis.
Rather than predicting a fixed direction, the framework allowed the market to confirm its intent.
👉 The breakout above 4123 validated the bullish scenario, while the short pathway remained untriggered — emphasizing once again that confirmation, not anticipation, drives execution.
📊 Week 11 – Downside Scenario Not Realized
Summary of this week:
- This phase of the study reflects a period where the market did not follow the projected downside count as anticipated.
- Price action remained largely range-bound, with no meaningful follow-through to validate the expected structure.
This week reinforces an important point:
structure alone is not enough — confirmation is essential.
📊 Week 12 – Executed Trade with Controlled Risk
🎥 Watch the Forecast Discussion (Week 12 Webinar)
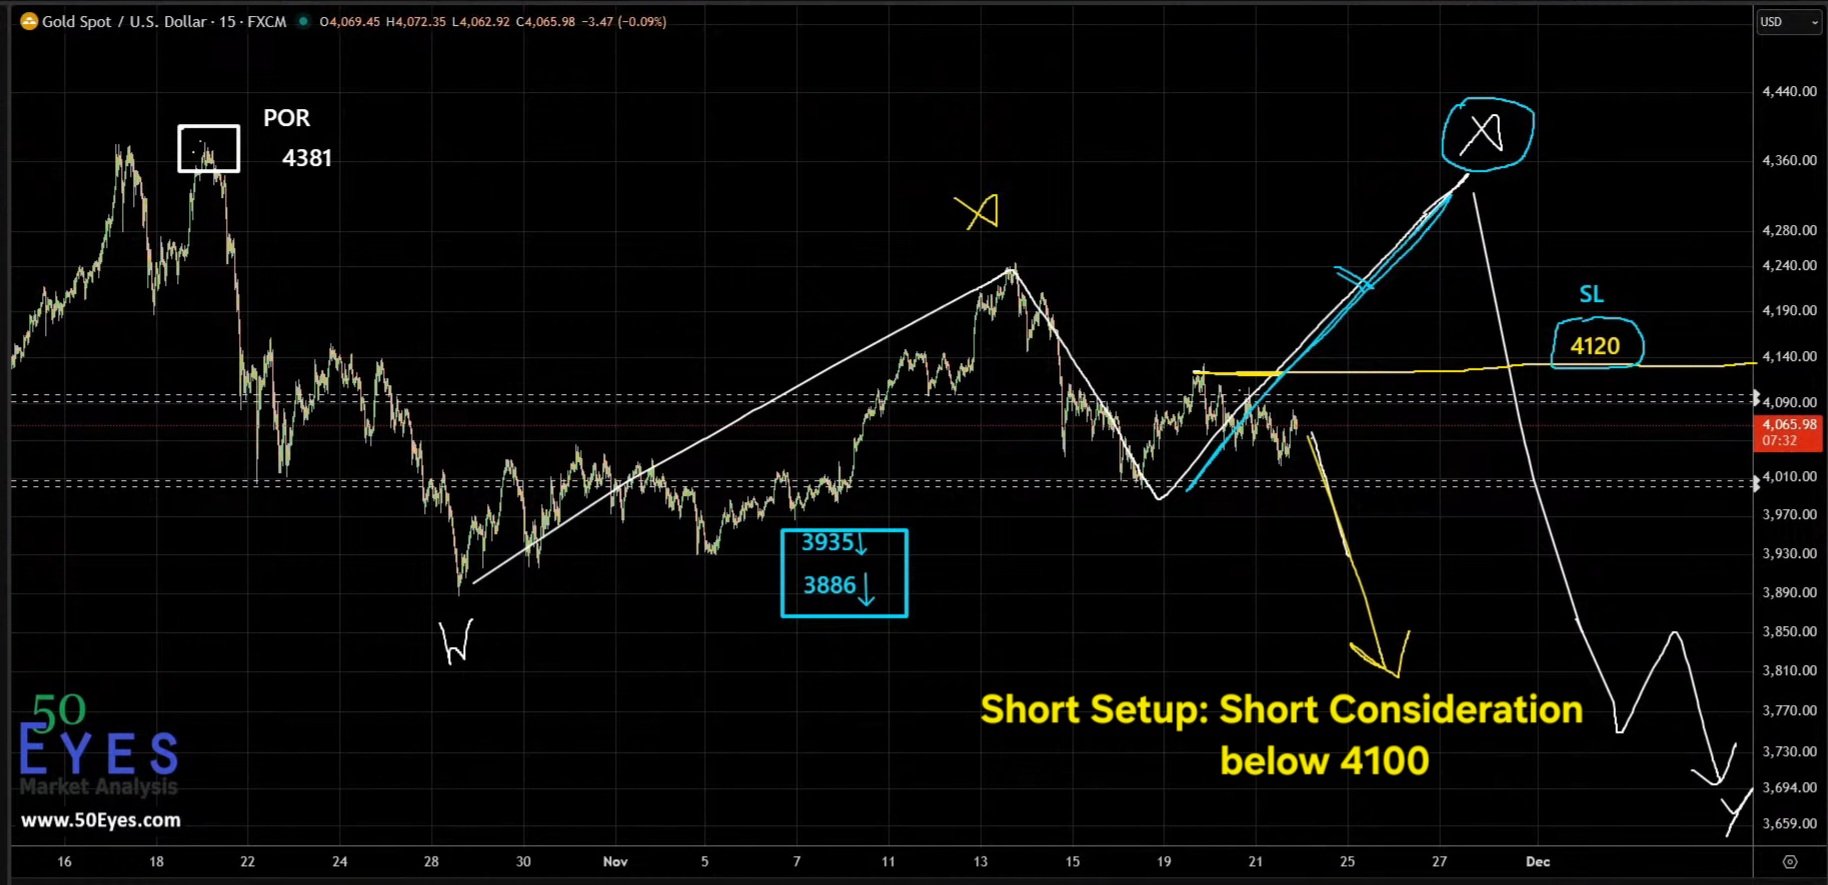
GOLD short trade consideration below 4100
In this session, the market was already positioned for a short trade.
An entry was established at 4143, with downside continuation expected.
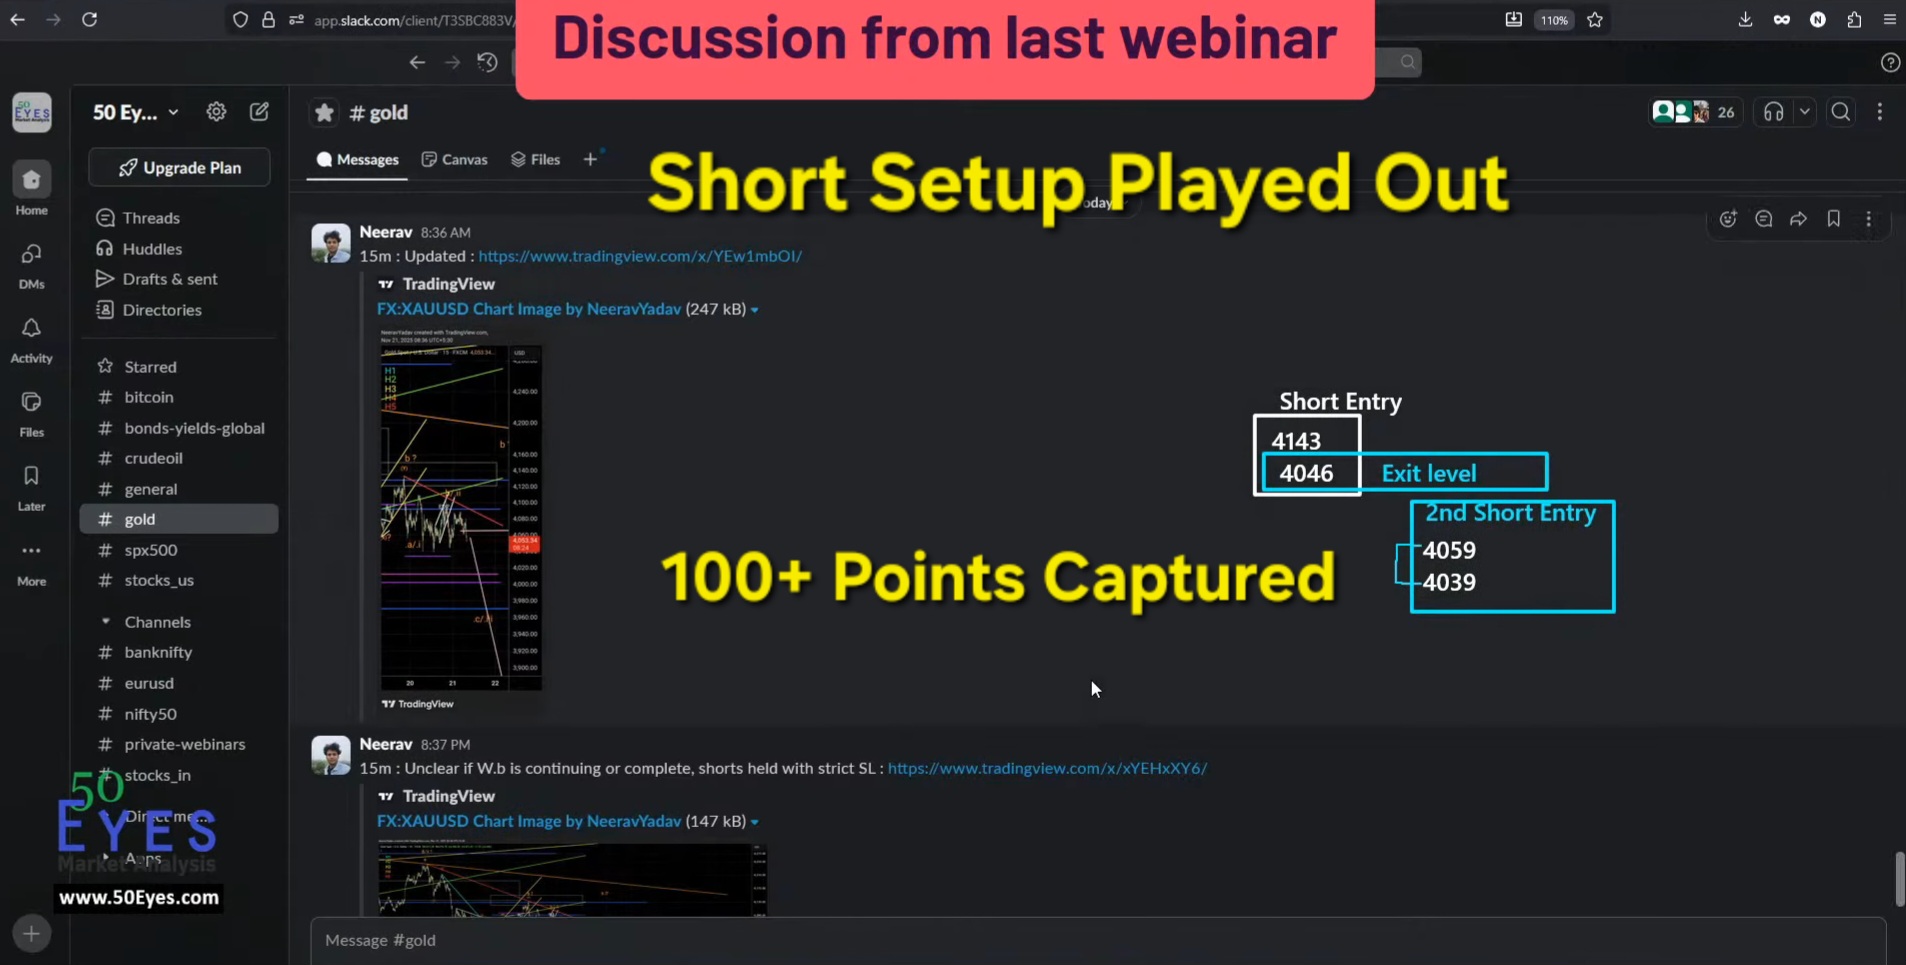
GOLD short trade setup played out precisely, captured a move of 100 points
Price moved lower as anticipated, reaching minimum projected targets.
A trailing stop at 4046 was implemented to protect profits, eventually getting triggered and securing gains.
Summary:
- ✔ Entry: 4143 (Short)
- ✔ Trailing Stop: 4046
- ✔ Minimum Targets: Hit
- ✔ Approx. Gain: ~100 Points
- ✔ Outcome: ✔ Profitable Trade Execution
This week highlights not just forecasting — but disciplined trade management and risk control.
📊 Final Verdict: Does Structured Gold Forecasting Actually Work?
After documenting 12 consecutive weeks of live gold forecasts, the outcome is not about perfection — it’s about consistency under real market conditions.
Based on the complete sequence:
- ✔ 8 forecasts played out with full validation
- ✔ 1 forecast remained active but untriggered (sideways continuation)
- ✔ 1 forecast delivered partial / conditional shift validation
- ❌ 2 forecasts did not materialize
📈 What does this translate to?
👉 66% Direct Forecast Accuracy (clean trigger → expected move)
👉 83% Structural Reliability (market respected defined levels & logic)
🧠 But the real takeaway is deeper than numbers:
This study shows that:
- ✔ The market consistently respected predefined levels
- ✔ Breakout-based setups (Weeks 5–8, 10) delivered the strongest moves
- ✔ Conditional logic (Week 3) worked better than fixed directional bias
- ✔ Non-trigger weeks (Week 2) helped avoid unnecessary risk
- ✔ Even in “wrong” weeks, structure prevented forced trades
👉 The edge was never prediction.
👉 The edge was reaction to confirmation.
📌 What This 12-Week Cycle Actually Proves
Across these weeks:
- ✔ 800+ points of opportunity were mapped in advance
- ✔ Multiple trades delivered 80–160+ point moves
- ✔ Key levels repeatedly acted as decision zones
- ✔ Forecasts adapted dynamically as price evolved
Some weeks were clean.
Some required patience.
Some didn’t trigger at all.
And that’s exactly how real markets behave.
🔍 The Bigger Insight
This case study was never about showing only winning trades.
It answers a much more important question:
👉 If the same structured approach is applied every week — does it hold up?
Over 12 weeks — it did.
Not perfectly.
But reliably enough to build a repeatable edge.
📍 Extended Track Record & Ongoing Work
The results presented in this study are part of a continuously maintained forecasting record spanning six years.
All projections are documented in advance and evaluated post-outcome, forming a structured dataset of market behavior across different conditions.
👉 Access full historical record: 80% plus accuracy for 6+ years
For practitioners interested in applying this framework in real trading environments, additional resources are available:
- Structured Elliott Wave methodology
- Forecast-to-execution workflow
- Risk-managed trade planning
👉 View Structured Elliott Wave Course
👉 Request details for Private Group
👉 Request details for Private Classes