How a 140+ Point Move Was Captured Live in a Short Trade
What if you could identify a major move in the market before it actually happens?
What if the analysis is not just a prediction — but a trade executed live and documented step-by-step?
In this case study, we will walk through a real example from the S&P 500, where a bearish hypothesis led to a 140+ point move captured in a short trade.
But this isn’t just about one trade.
It is about a structured approach to market forecasting.
For more than 10 years, market analyst Neerav Yadav has been forecasting global markets using technical and structural analysis, with a documented accuracy of over 80%. Many of these forecasts are publicly recorded through webinars and videos.
This case study shows exactly how one such forecast unfolded.
But before we jump to the results, let’s start from the beginning.
Understanding the Market Context
The S&P 500 is one of the most widely followed stock indices in the world, tracking the performance of around 500 of the largest companies listed in the United States. It represents roughly 80% of the total U.S. stock market capitalization, making it a key indicator of global financial sentiment.
Because of its importance, even short-term movements in the S&P 500 can create large trading opportunities.
👉 And that is exactly what happened in this case.
The Hypothesis: Was Another Leg Down Coming?
Every successful trade begins with a clear hypothesis.
During a live market discussion, the price of S&P 500 was trading around 6032–6040.
The question was simple:
👉 Was the market preparing for another move higher, or was a downward leg still remaining?
🎥 Video 1 — Market Hypothesis
Key Idea Explained Simply
The analysis suggested that the market might be forming a flat correction structure.
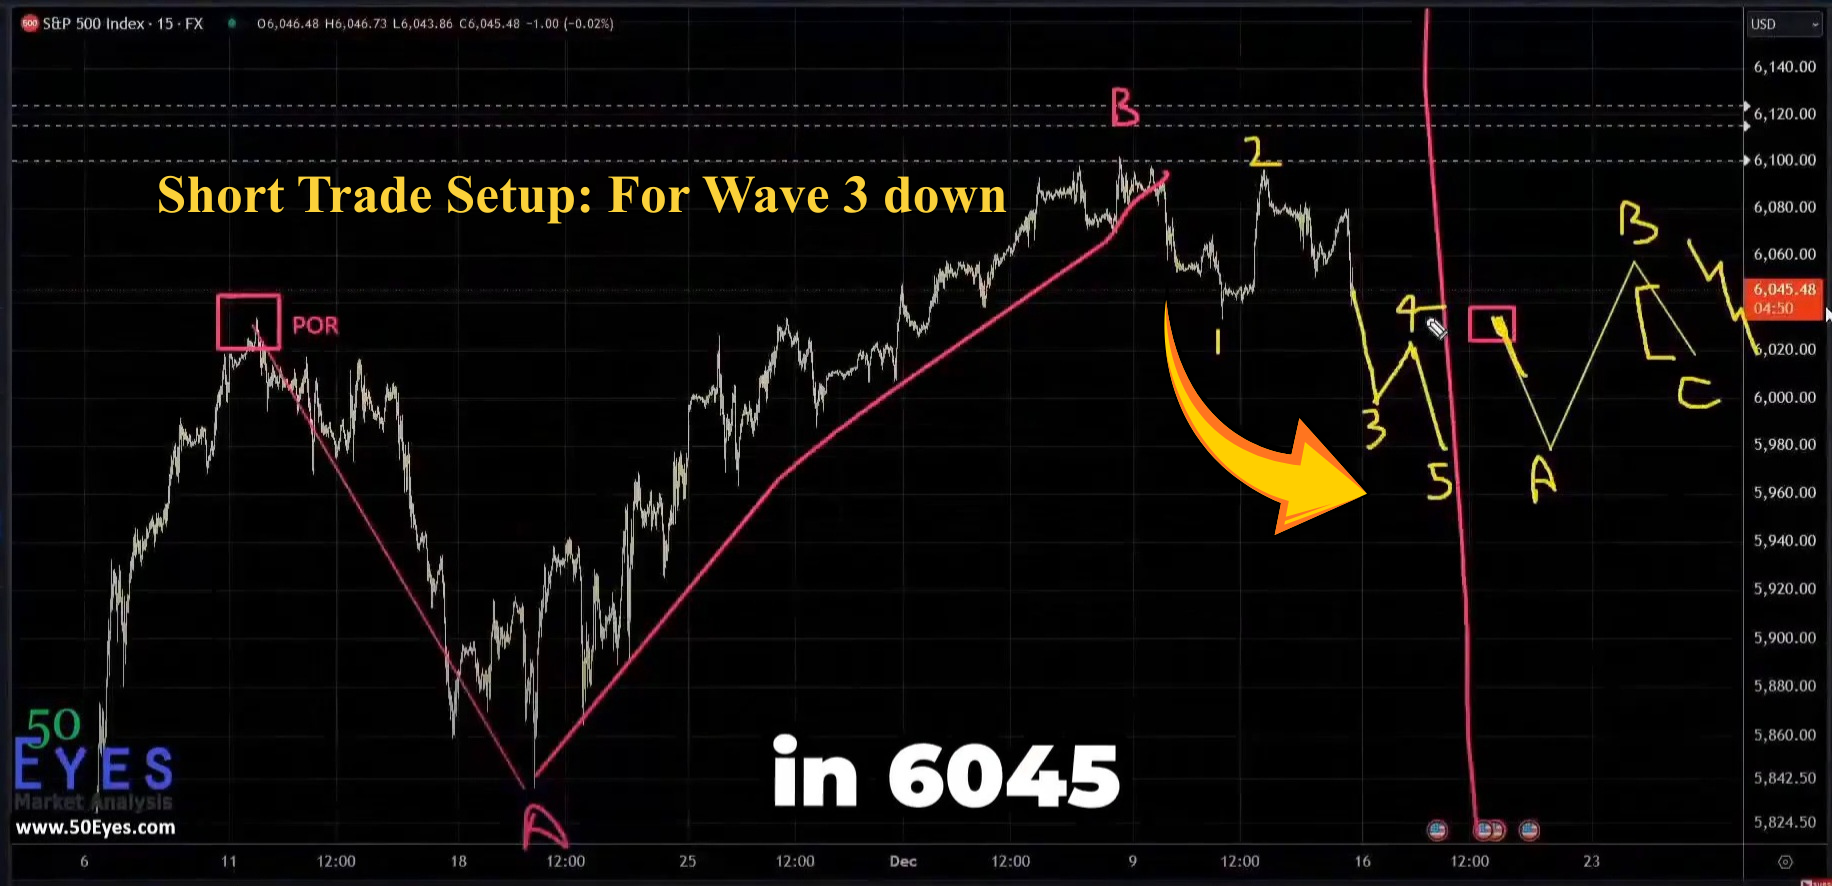
S&P 500 short trade setup for wave 3
In simple terms:
- • Wave A had already formed
- • Wave B possibly completed
- • Wave C (downward move) could still be remaining
And if this interpretation was correct, the market still needed to complete one more leg downward.
👉 The expectation was straightforward:
If Wave C unfolds, the market should move significantly lower.
Based on this structure, short positions were initiated.
The Big Question
But here is the real question traders always face:
Was this analysis correct?
Markets often surprise traders.
Sometimes patterns fail.
👉 So what happened next?
The Result: 140+ Point Move Captured
Once the analysis was in place and the short position was active, the market started moving.
And the move was not small.
🎥 Video 2 — Live Chart Result
The price had been near 6045, and the market began falling rapidly.
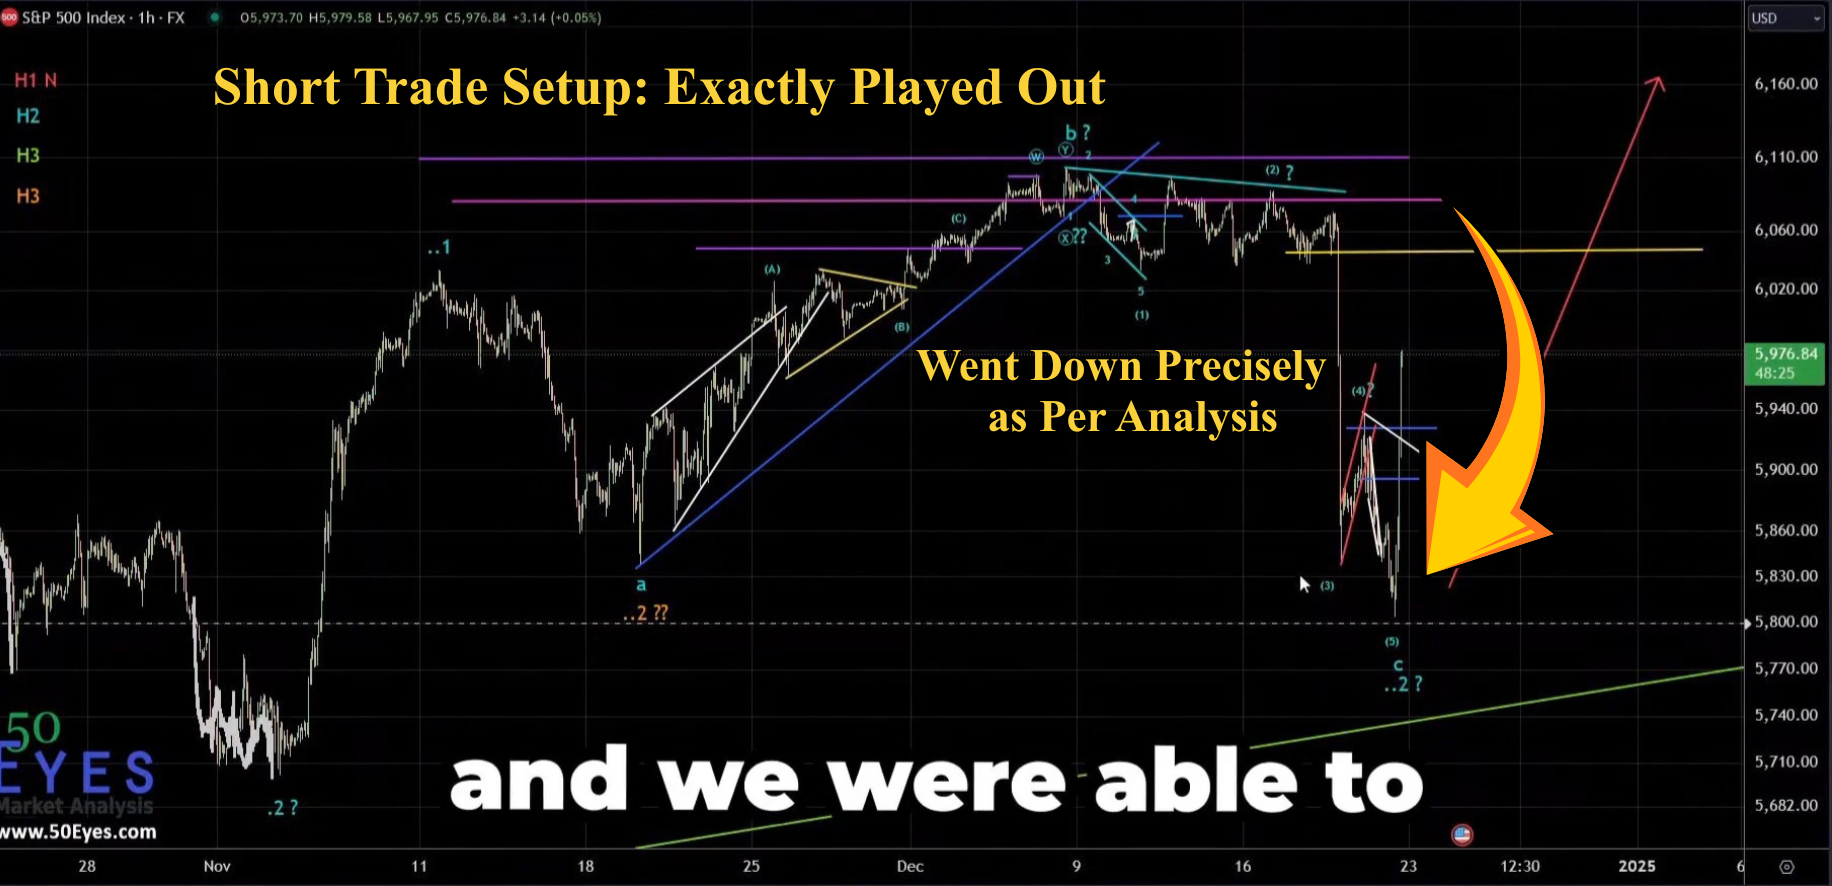
S&P 500 short trade setup played out exactly capturing 140 points move
The trade management looked like this:
- • Short position held during the move
- • 75% of the position closed after capturing 140+ points
- • Remaining position protected with a trailing stop
Eventually, the trailing stop was also hit in profit.
👉 Which means:
The entire trade closed profitably.
But Was This Trade Actually Executed Live?
Anyone can show a chart after the fact.
The real test of credibility is documentation during the trade itself.
That’s why the trade was also discussed inside a private Slack trading group, where entries and management were recorded.
Let’s look at that.
Trade Documentation and Record Keeping
🎥 Video 3 — Slack Trade Proof
Here is how the trade unfolded step-by-step:
Entry
Short positions were initiated around 6040, with additional shorts added as the market moved lower.
Profit Booking
Around 5890, approximately 75% of the position was closed.
This captured the bulk of the move.
Trailing Stop
The remaining position was protected with a trailing stop at 5930.
Eventually the trailing stop was triggered, closing the final position in profit.
👉 Everything — entry, management, and exit — was documented live.
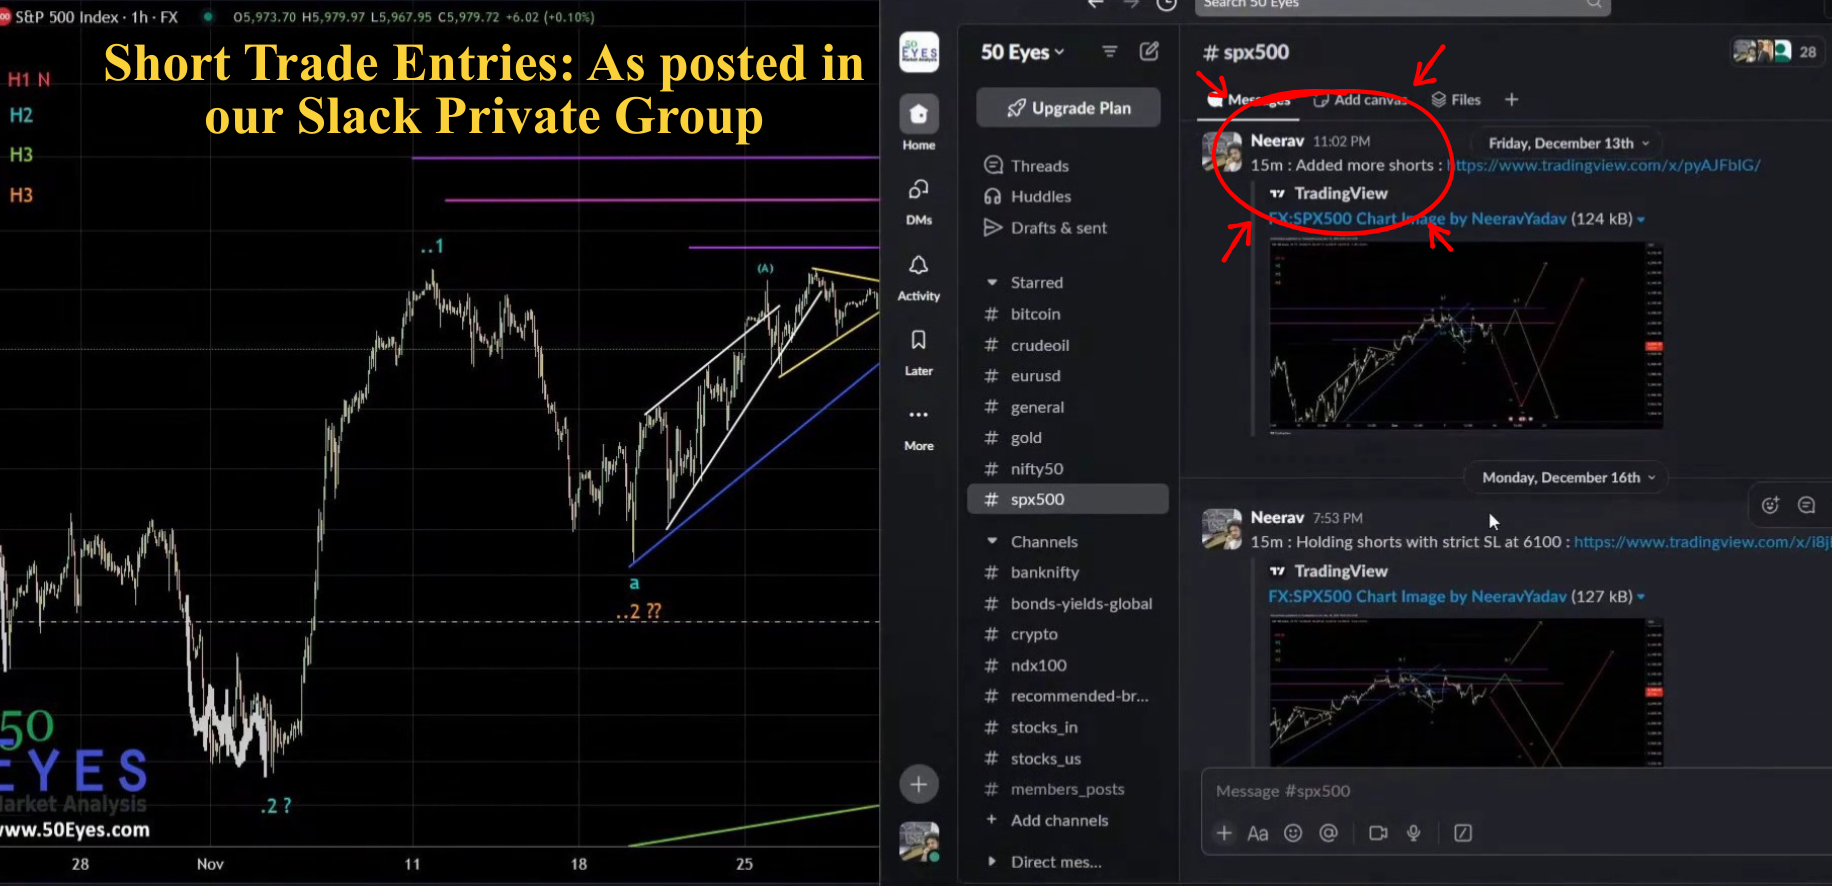
S&P 500 short trade entries illustrated in slack private group
Why This Case Study Matters
Many trading discussions focus only on analysis.
But professional trading requires three things:
- 1️⃣ A clear hypothesis
- 2️⃣ Execution of the trade
- 3️⃣ Proper risk and profit management
👉 This case study demonstrates all three.
It shows how a structured analysis can translate into a real trade with measurable results.
Key Takeaways from This Trade
- 1. Structure matters
Understanding market structure can help anticipate potential moves. - 2. Execution is critical
Even the best analysis only matters if it is actually traded. - 3. Risk management protects profits
Closing partial positions and trailing stops helped lock in gains. - 4. Documentation builds credibility
Trades that are recorded and shared live provide transparency.
Final Thought
So the real question is:
👉 Was this just one lucky trade?
Or is it the result of a consistent analytical framework applied across markets?
This S&P 500 trade is just one example among many documented forecasts.
More importantly, the entire process — analysis, execution, and exit — was documented live.
Over the past 10+ years, Neerav Yadav has consistently analyzed global markets using a structured approach, with a documented accuracy of over 80% across multiple forecasts.
This S&P 500 trade is just one example of how market structure, discipline, and risk management can combine to identify meaningful opportunities in financial markets.
Across markets like Gold, Euro, Crude Oil, and indices, the same analytical approach has been used to identify high-probability setups.
👉 And when the structure aligns, the market often reveals its direction clearly.