In my last video report I was expecting bearish movement and so far market has been in line with that view by moving below Wave W low.
As of now there are 2 possible cases in which I see this market progressing.
Hypo 1 (Red) : Suggests that we are going to see a Triangle formation for Wave X before the next leg down.
Hypo 2 (Cyan) : Considers that we have completed the Wave Y at the current level and suggests that we are going to see a possible Triple Zig Zag formation.
It is also worth noting at this point that we are seeing Wave W= Wave Y that is 1:1 equality and hence small intraday longs can be initiated at this level.
If this market goes above the 66.28 level then the short side or the correction would have been completed and we will need to take another look at the chart.
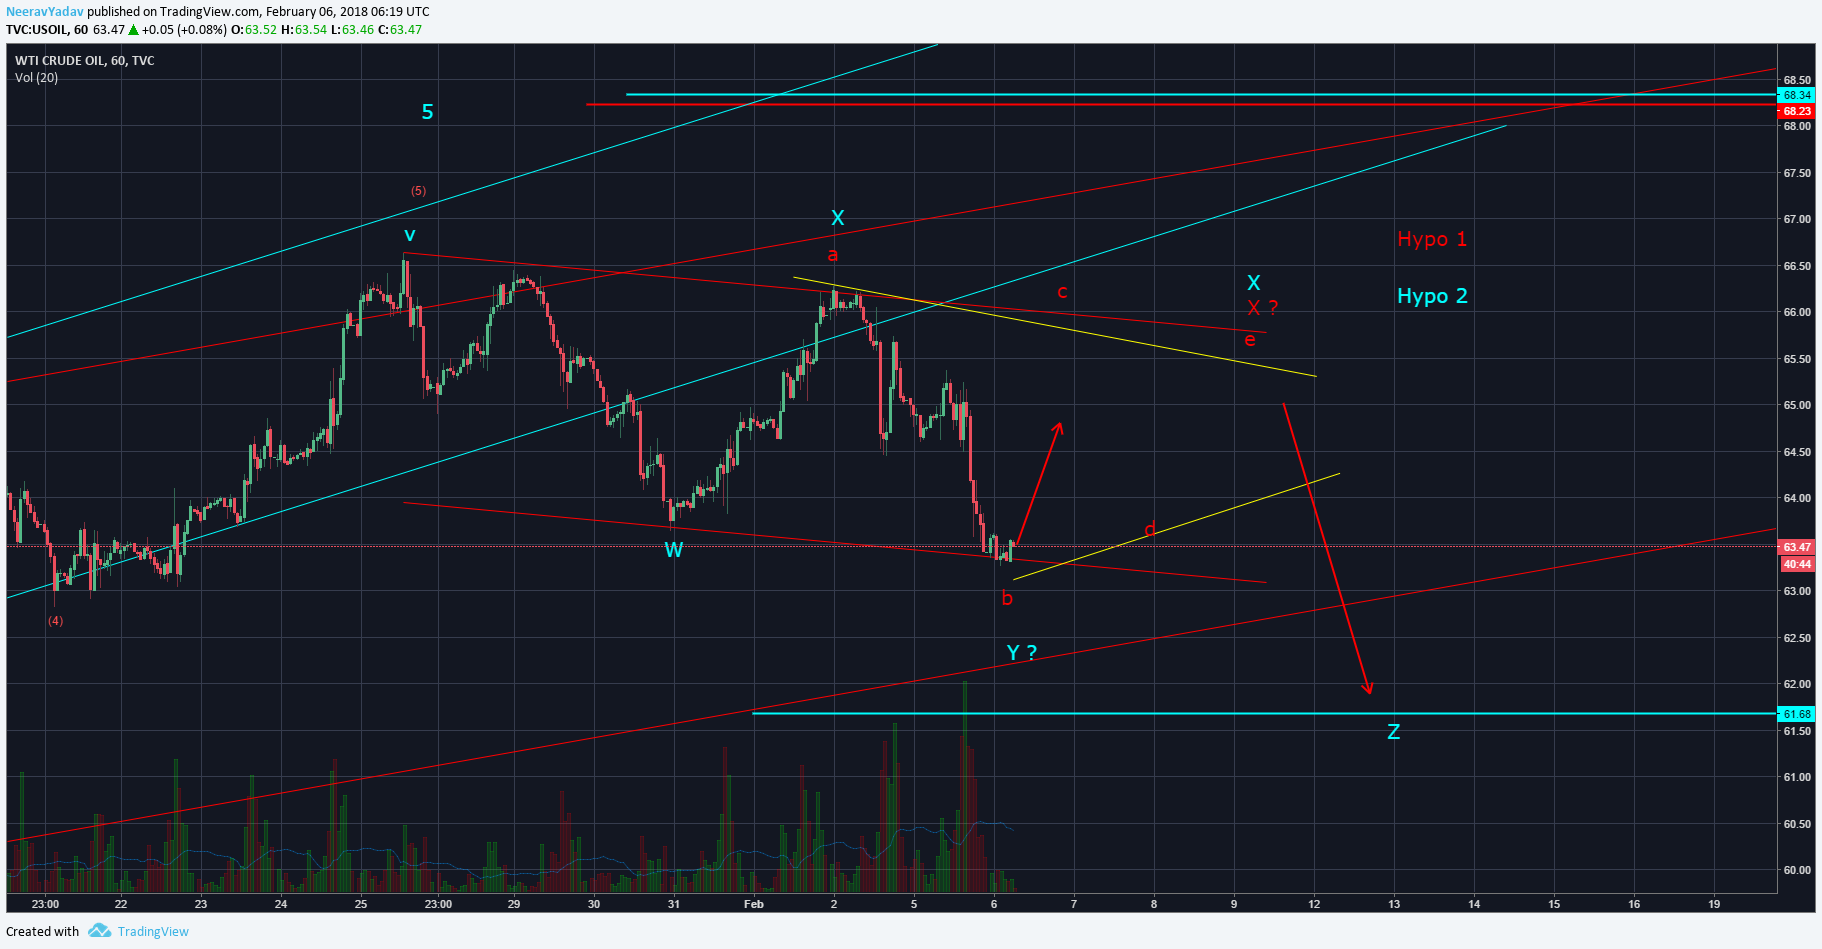
Crude Oil Elliott Wave Analysis 6th February 2018 onwards
Let’s see how this market progresses.
Get 1 month free entry to the private group and learn to trade using Elliott Wave Principles – My Video Course
To receive these updates at the earliest you can subscribe to my Emailing List.
Disclaimer – All content presented here is strictly for educational purpose, do read the complete site disclaimer before taking any action.