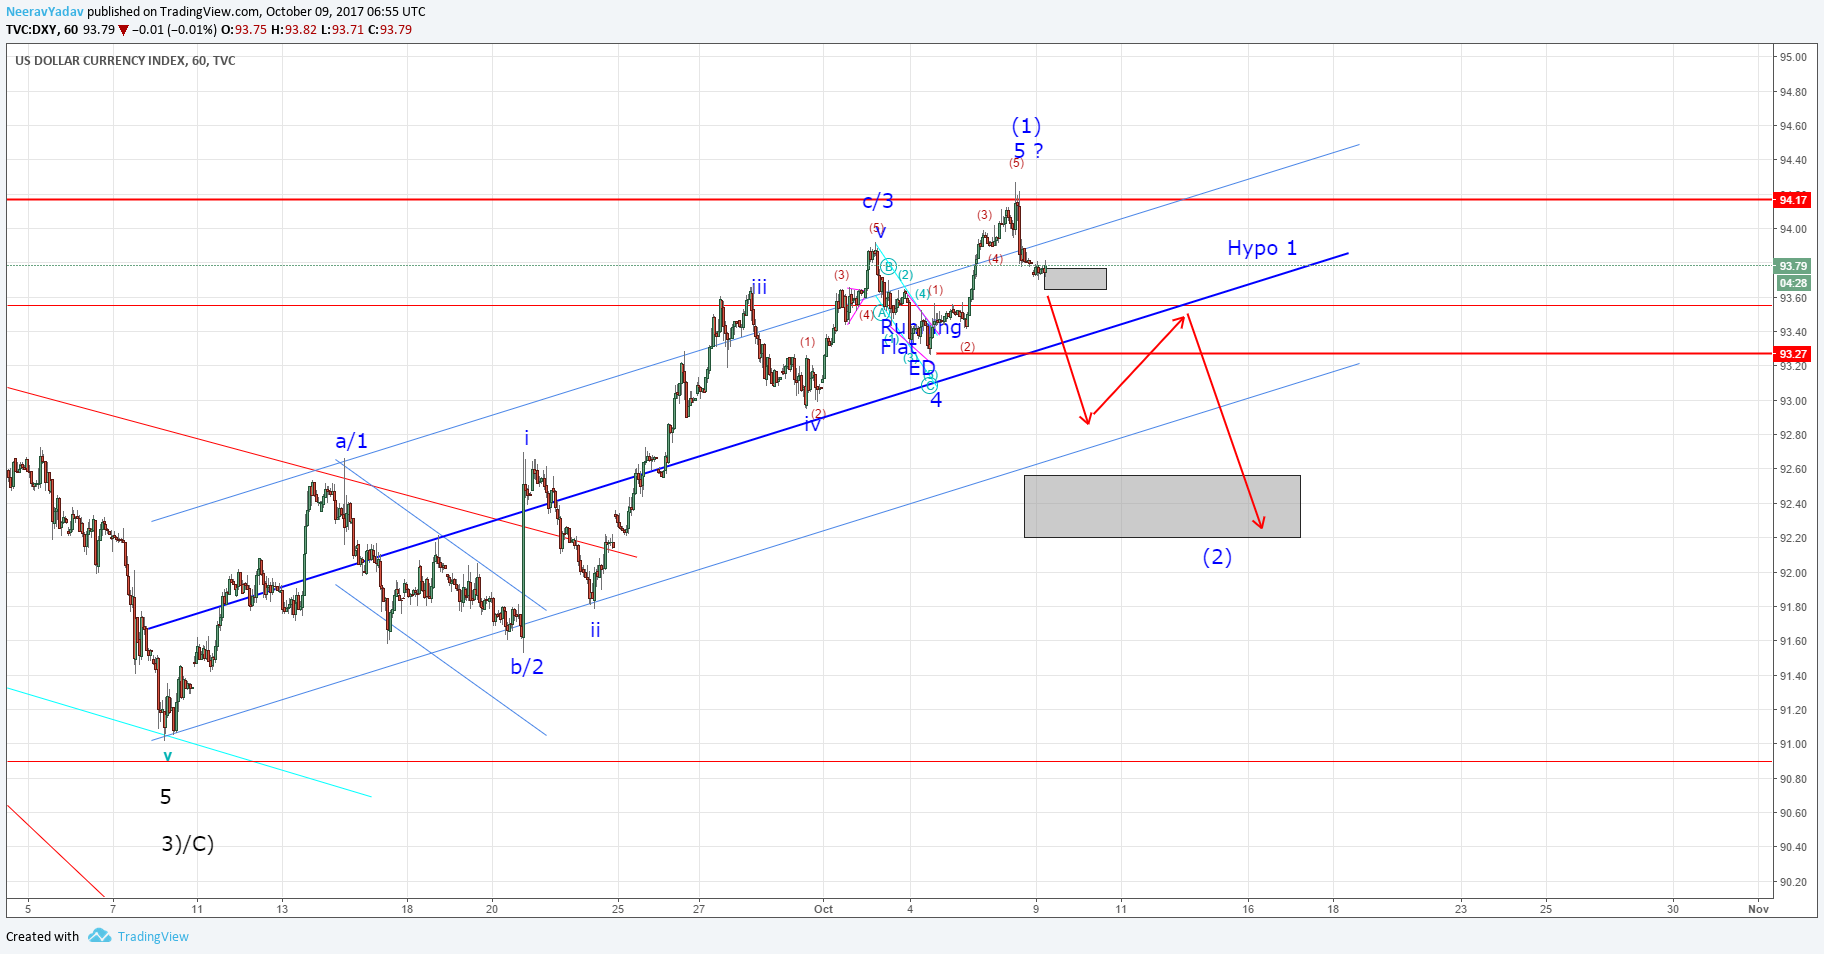
In my last post I mentioned the target for upside movement in Dollar Index as 94.17 (Target 1) which was achieved on 6th October.
As of now the Dollar Index has formed a reversal right at the Target 1 level at 94.17 and looks to be heading down for a 3 legged correction to the 92.55-92.20 region.
As such there are two scenarios that can play out from here :
- Hypo 1 : The Wave 5 (Blue) got completed at 94.26 and hence Wave (1) is now completed and the prices are moving down for Wave (2) in an A-B-C type of correction. It is also worth noting that Wave 5 = .618*Wave 1.
- Hypo 2 : Wave 5 (Blue) is still continuing and at 94.26 we only have Wave .1 of Wave 5. If this is the case then we are going to see a reversal from the 93.77-93.63 levels.
As such my bias is with Hypo 1 however confirmation for the same will come when this market breaks below Wave 4 low at 93.27.
Hence the downside target for Wave (2) going with Hypo 1 are :
Target 1 : 92.55
Target 2 : 92.20
SL : Above 94.28
Get 1 month free entry to the private group and learn to trade using Elliott Wave Principles – My Video Course
To receive these updates at the earliest you can subscribe to my Emailing List.
Disclaimer – All content presented here is strictly for educational purpose, do read the complete site disclaimer before taking any action.

