In this report I have discussed the possible scenarios that can play out in the Gold Futures Market (XAU/USD), I have used Elliott Wave for the purpose of this discussion.
Basically there are two counts that can play out as of now, my personal bias is towards the Leading Diagonal Count however I have discussed detailed strategy for trading both the case scenarios.
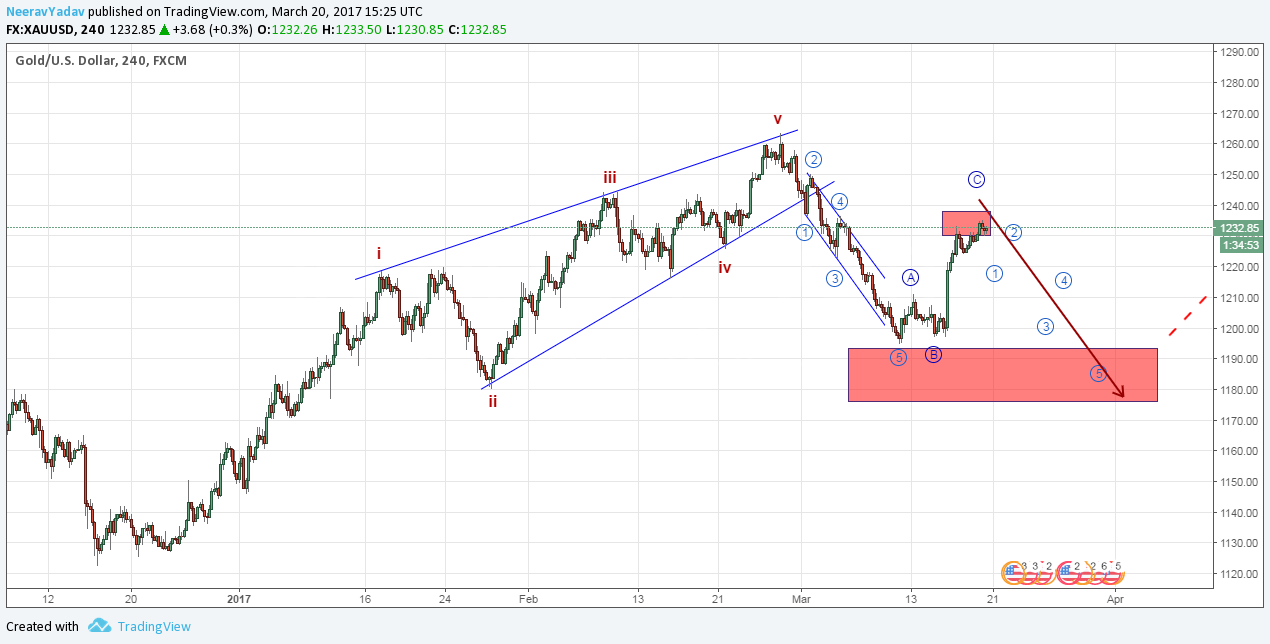
Gold Main Elliott Wave Count indicating that a Wave C down will play out (20th March 2017)
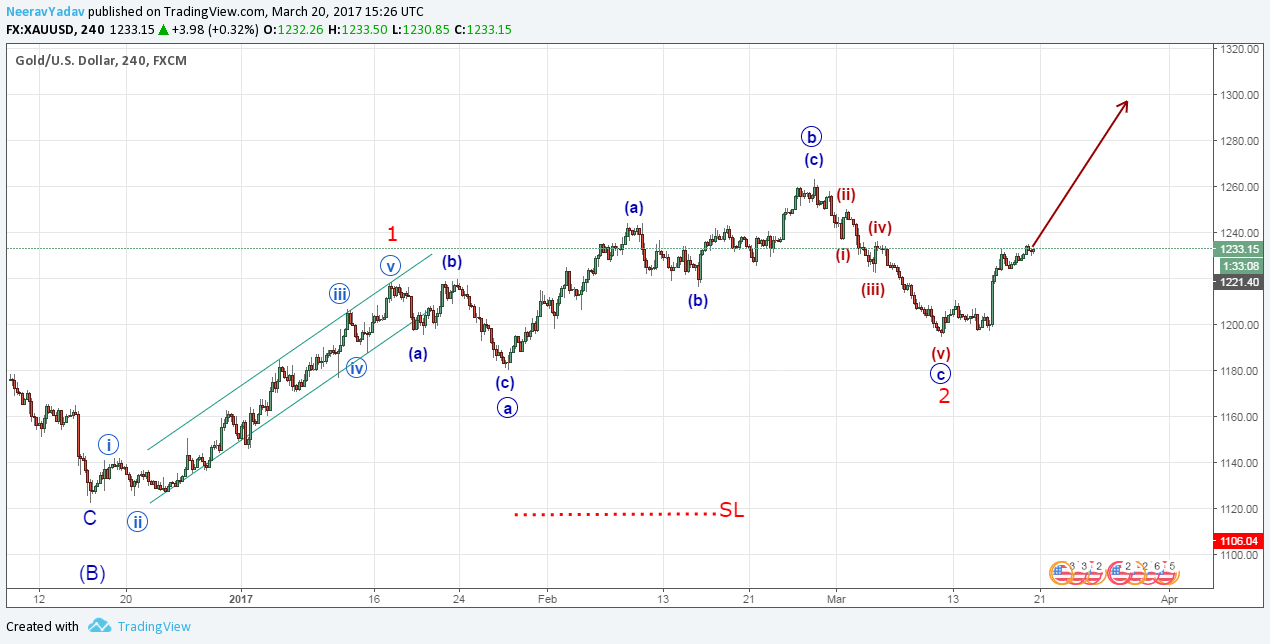
Gold Alternate Elliott Wave Count Pointing to a Bullish Price Movement (20th March 2017)
In conclusion the price level of 1230 to 1240 will determine that which wave count will play out, if the market takes support over this level then we will look to go long, however if the market gives a reversal in this zone then we will look to go short.
My personal bias is that the markets will face a resistance in this zone and will turn to give a leg down which in terms will complete the Wave 2 progression.
Learn to trade using Elliott Wave Principles – My Video Course
To receive these updates at the earliest you can subscribe to my Emailing List.
Disclaimer – All content presented here is strictly for educational purpose, do read the complete site disclaimer before taking any action.