As of now I have 2 counts for Gold (XAU USD).
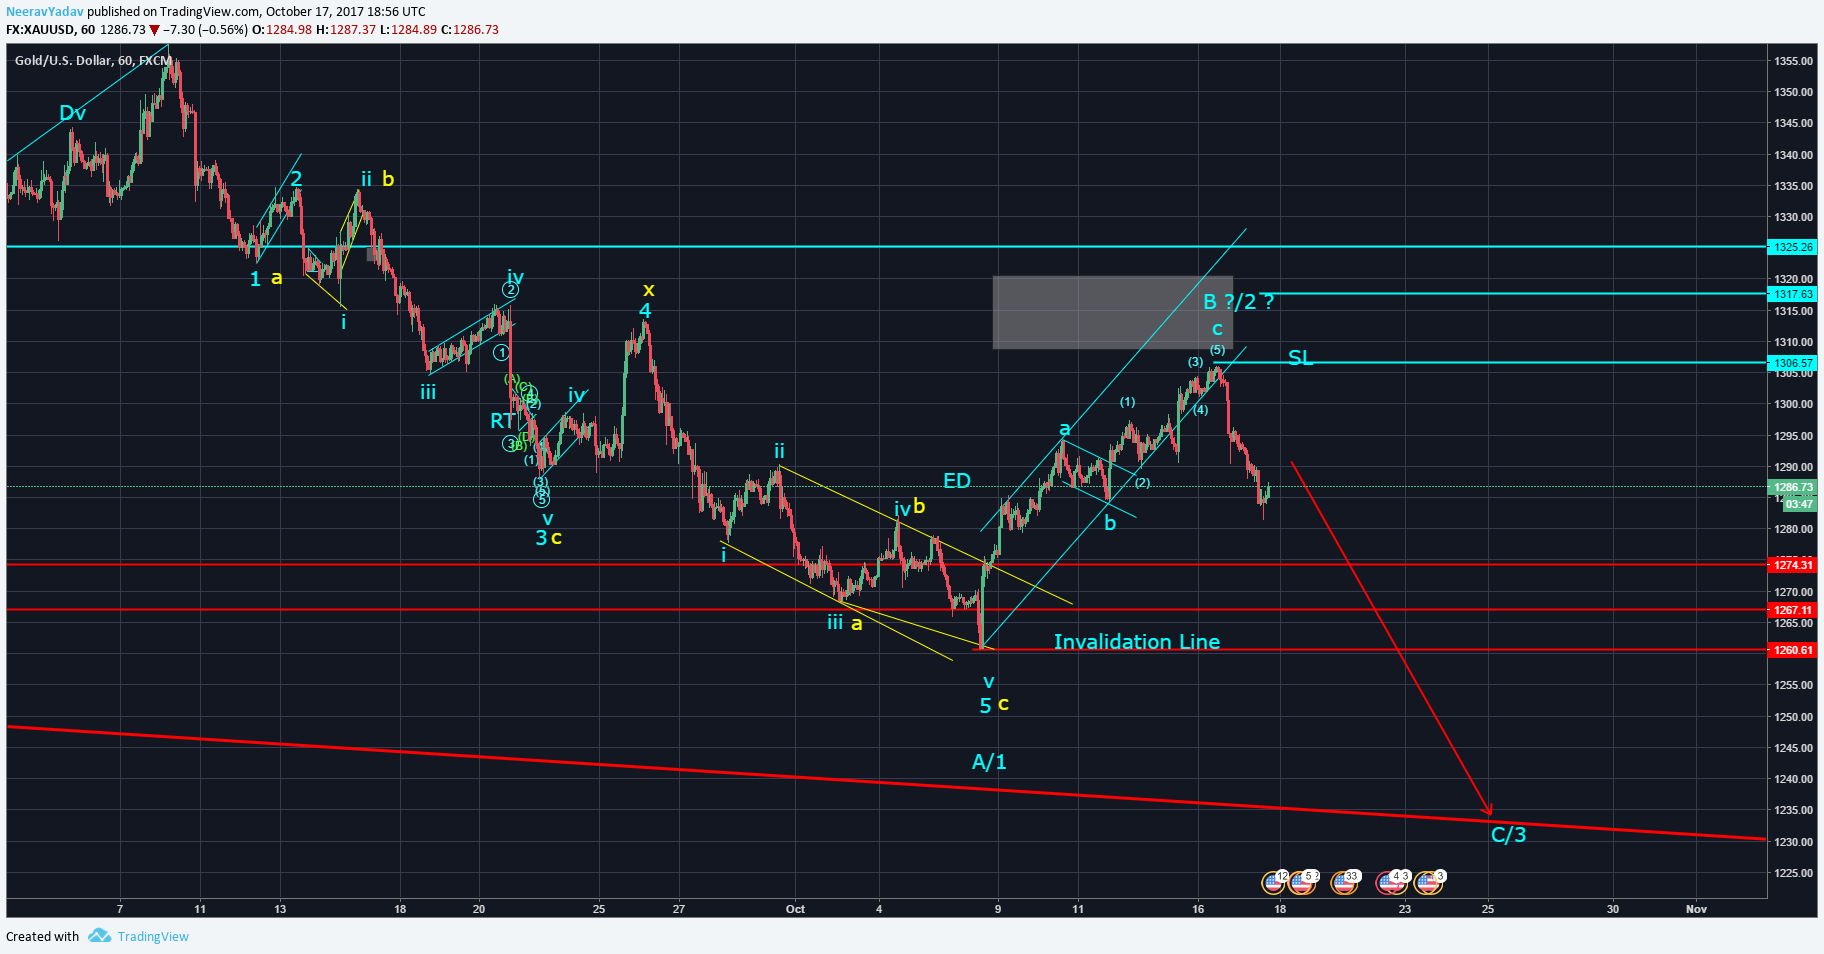
Main Count / Hypo 1 : Cyan
Alternate Count / Hypo 2 : Yellow
As per the main Elliott Wave Count in Gold :
We have just completed a Wave A/1 at the 1260 level and have either completed or are still progressing in Wave B/2 which means that we are not going to see any movement above the 1306.60 level untill the Wave C/3 low is being established.
The 2 cases that are possible from here on are :
- The Wave B is still continuing in some sort of Triangle or another corrective formation.
- Wave B has already completed around 1306 and we are currently moving down in Wave C.
In either case we can keep a Stop Loss at the Invalidation level of this pattern that is at 1306.60 and trade on the short side.
As per the alternate count :
We were in a Double Zig Zag type of correction from the 1357 to 1260 level and hence the move from the 1260 low can either be the continuation of the pattern as a Triple Zig Zag or the start of a new impulse to the upside.
Also since the move from the 1260 to 1306 looks like a 3 legged up move the bias remains that it can the continuation as a Triple Zig Zag.
Hence if we consider both Main count and the Alternate Count then we see that both are pointing in the downward direction for now.
Hence if this analysis is correct then this market can see more downside :
SL : 1306.60
Target 1 : 1246
Target 2 : 1230
Target 3 : 1209
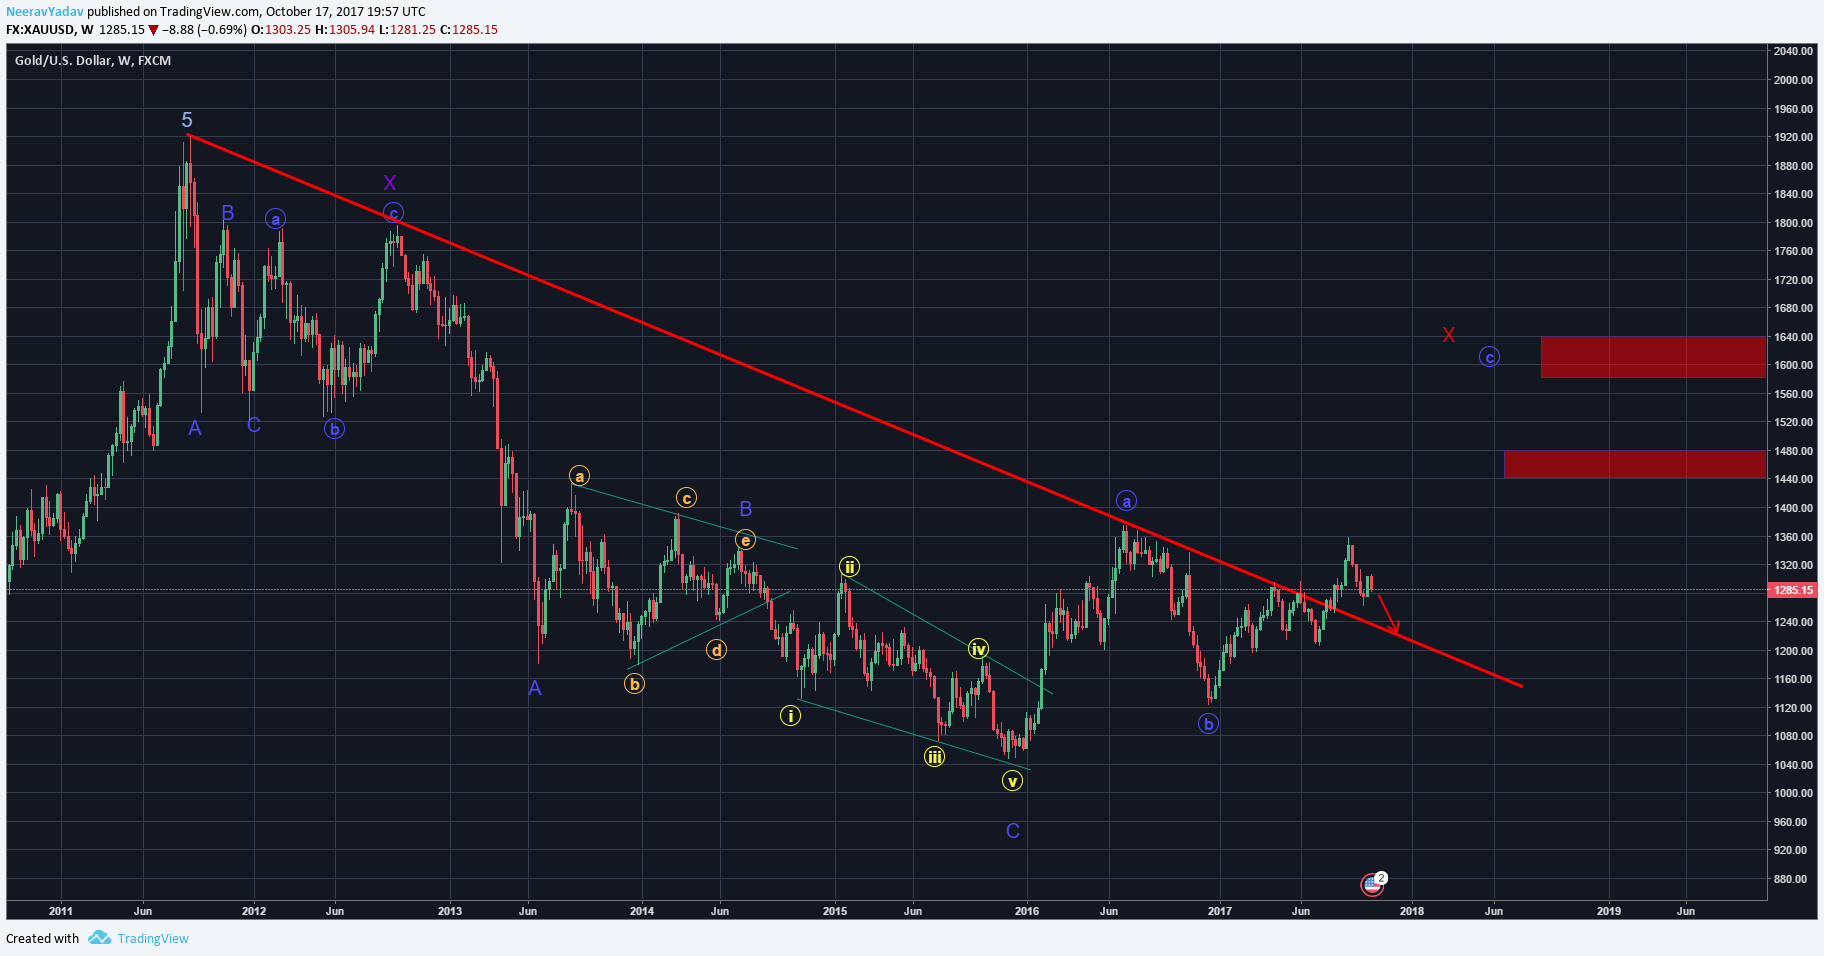
Also it is worth noting that on the Weekly Chart we have an Important Trend Line that will most likely see a retest as it was broken to the upside a few weeks ago and the levels for the trendline also suggest that Gold can see targets of 1230 or lower.
Get 1 month free entry to the private group and learn to trade using Elliott Wave Principles – My Video Course
To receive these updates at the earliest you can subscribe to my Emailing List.
Disclaimer – All content presented here is strictly for educational purpose, do read the complete site disclaimer before taking any action.


