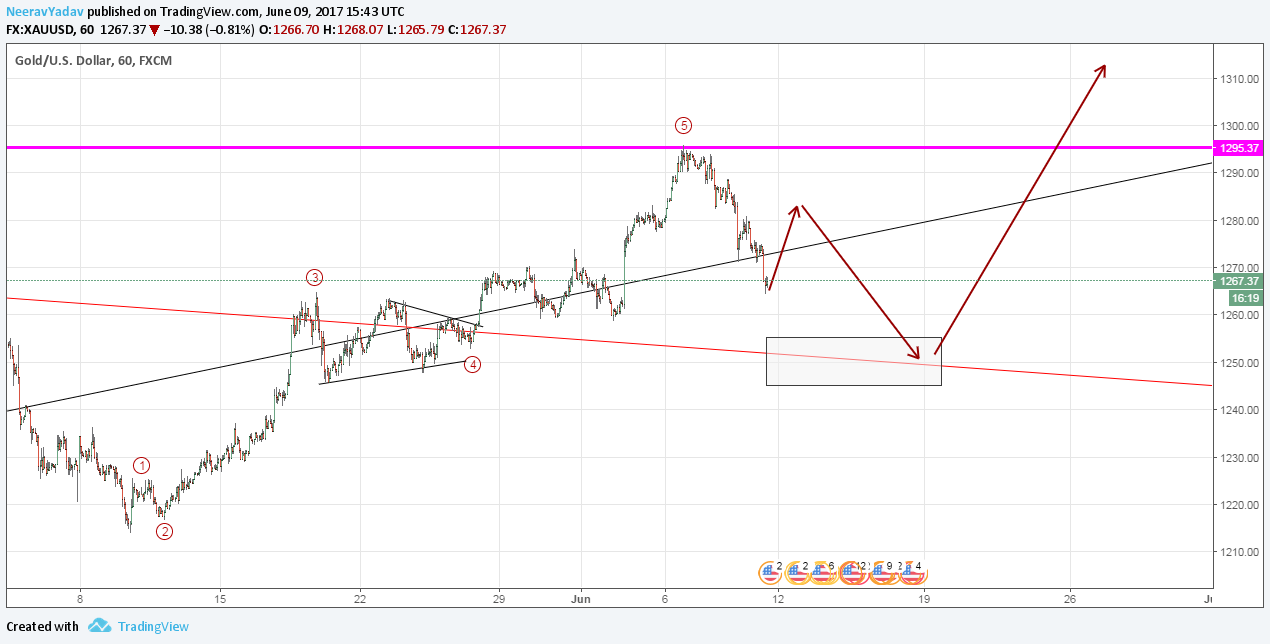
As per the count presented on the chart it seems highly likely that Gold is getting ready to head higher.
It seems that the current corrective leg down can take support in the 1255-1245 region and then the bullish Wave 3 can start, however if the market trades below 1245 and takes 1255-1245 as resistance then it is possible then we might be in some kind of complex Wave 2 correction.
To know upside targets and for a more detailed video analysis check my previous post.
My current bias is bullish, I will update further as this market progresses.
Learn to trade using Elliott Wave Principles – My Video Course
To receive these updates at the earliest you can subscribe to my Emailing List.
Disclaimer – All content presented here is strictly for educational purpose, do read the complete site disclaimer before taking any action.

