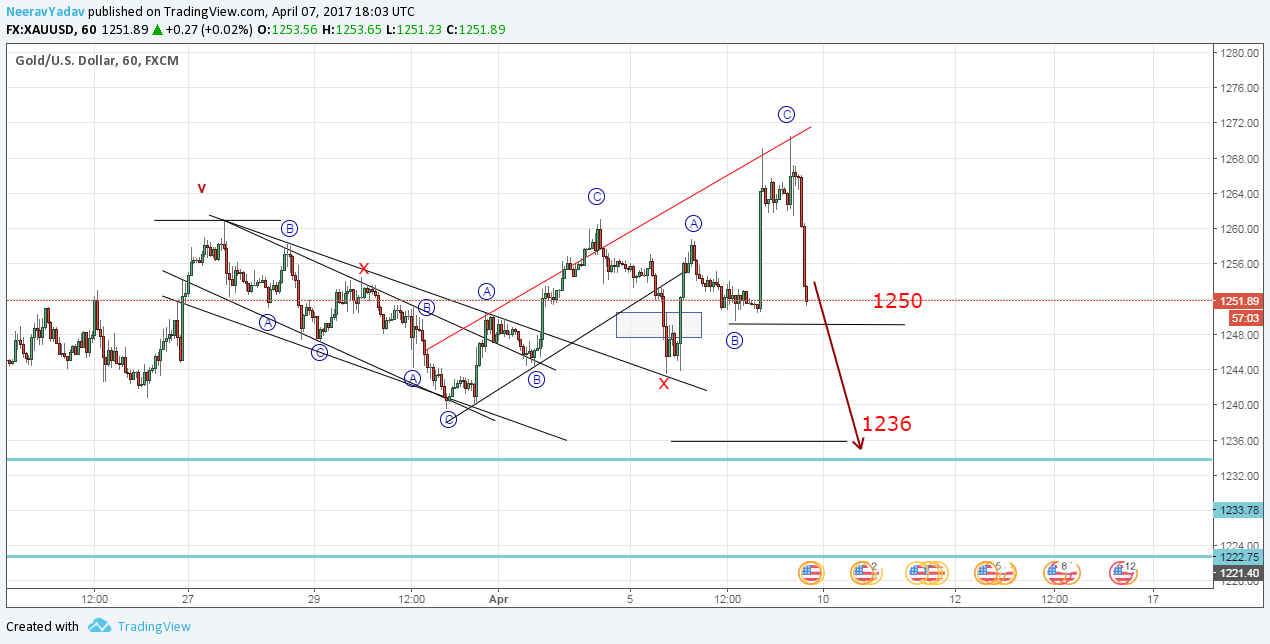
As long as the red trendline is not broken on the upside I don’t think there is much point in looking at bullish counts, hence I have only discussed the most probable bearish count in this article.
Looks like the Wave B was a double Zig Zag and the Wave C has already started as an impulse down in 5 Waves.
Based on this count the most probable target for C are : 1250, 1236.
Gold looks like it’s still a flat correction 7th April 2017 onwards (Elliott Wave Analysis)
Please note that at this point there are a lot of counts that can be taken as an alternate view, if I discuss all of them the situation will become quite confusing, hence I have only discussed the most probable count here.
I will update further as the market progresses.
Learn to trade using Elliott Wave Principles – My Video Course
To receive these updates at the earliest you can subscribe to my Emailing List.
Disclaimer – All content presented here is strictly for educational purpose, do read the complete site disclaimer before taking any action.