For a detailed outlook and trading strategy check the below video report.
As per the daily chart of Bitcoin (BTC/USD) below,it seems that BTC has completed a Triangle formation (As per Elliott Wave Terminology).
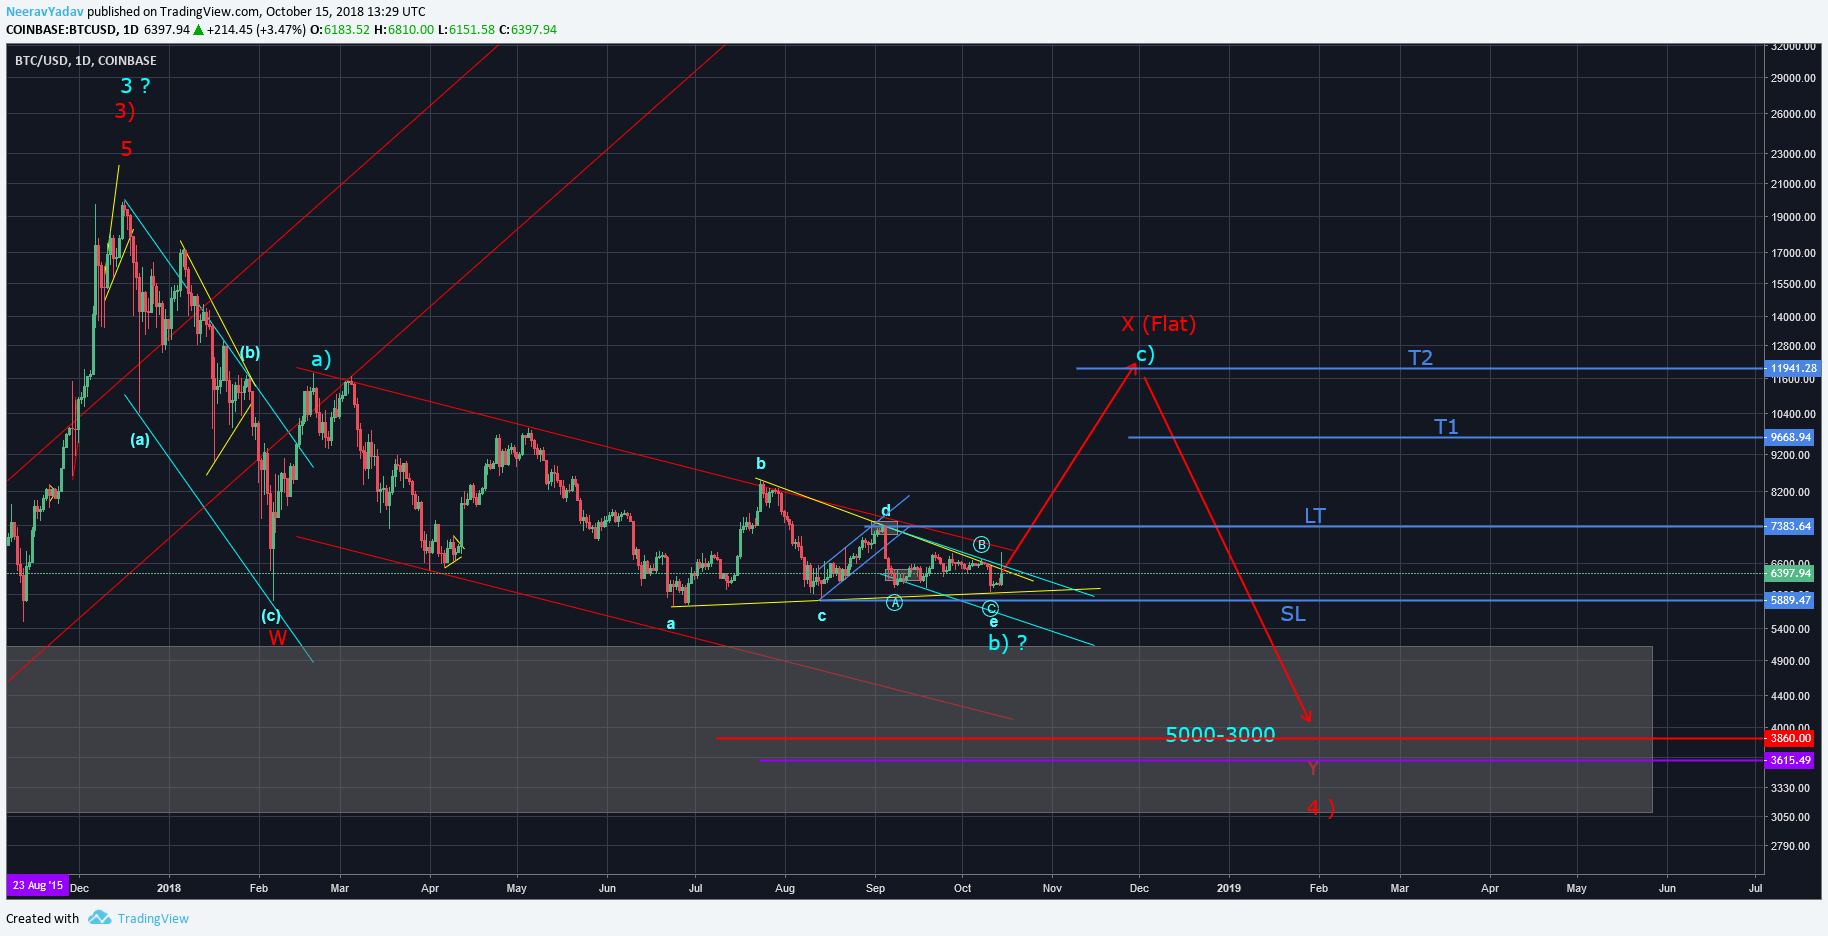
Bitcoin Daily Chart (15th October 2018) Elliott Wave Count
The Triangle seems to be in Wave b) of Wave X which seems to be moving as a Flat structure. A clear break above the Wave d high of this Triangle would suggest that we can see higher level as specified on the chart, however if we see a Invalidation of this pattern, that is market going below the Wave c low of this Triangle then that would serve as a Stop loss for any longs and we can expect lower levels into the white support zone present on the chart.
As such this pattern is providing trading opportunities for both sides with adequate stop levels and hence should be paid attention to.
2017 forecast accuracy 87.5% : Track Record
Details regarding one to one training : Click Here
Get 1 month free entry to the private group and learn to trade using Elliott Wave Principles – Video Course
To receive these updates at the earliest you can subscribe to my Emailing List.
Disclaimer – All content presented here is strictly for educational purpose, do read the complete site disclaimer before taking any action.