In the last video update posted above the Elliott Wave analysis suggested two probabilities, both were pointing in the upward direction form a swing perspective for Gold (XAU/USD) however there was no clear entry signal.
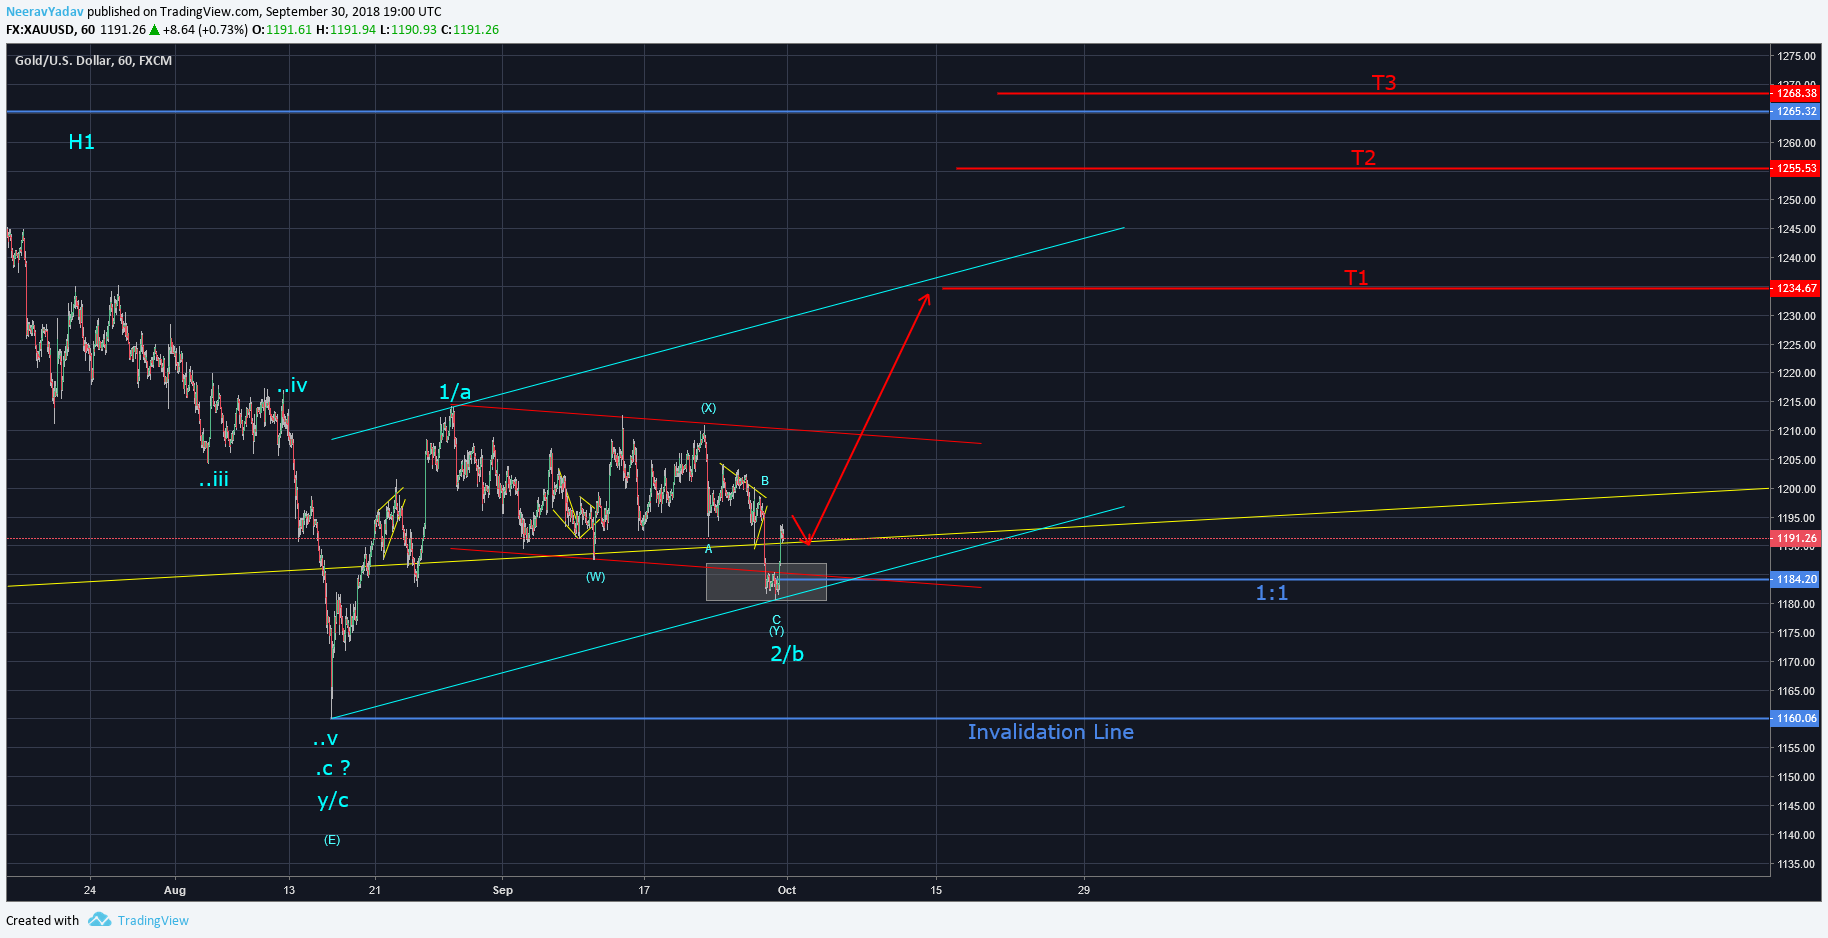
Gold Hourly chart Elliott Wave Count , suggesting upside (1-10-2018 onwards)
In the Hourly chart posted above there are some strong indications that this market will see a move to the upside.
- As such it looks like the Wave 2/b has completed as a complex w-x-y correction.
- The measure of Wave (w) projected from end of W.(x) is very near to the point where Wave (y) seems to have completed.
- Also since the price move of Wave 2/b seems to have completed exactly in the most likely retracement zone (white support zone) this adds even more strength to the count.
Based on the above facts we can expect to see upside in Gold in the coming sessions which can take it to :
Target 1 : 1234
Target 2 : 1255
Target 3 : 1268
Since the structure will get Invalidated is see a move below 1160 hence the same should be treated as Stop loss level.
This is all based on the Hourly chart, if this market follows the Wave counts suggested in the video linked above then we can see levels even higher then 1310.
2017 forecast accuracy 87.5% : Track Record
Details rega/50eyes.com/forecast-accuracy/rding one to one training : Click Here
Get 1 month free entry to the private group and learn to trade using Elliott Wave Principles – Video Course
To receive these updates at the earliest you can subscribe to my Emailing List.
Disclaimer – All content presented here is strictly for educational purpose, do read the complete site disclaimer before taking any action.