After the decline from 10000 + level which was the suggested target level as mentioned in my last video reports it seems that we have a 5 legged down movement which seems to be followed by a Triangle, since triangles can not appear in Wave 2 positions hence the most likely possibility is that Nifty will see another leg down from here on as a Wave C down once the level of 9784 is broken which is also the low of Wave D in the Triangle Wave B (Circled).
If things proceed as expected then we can expect Wave C to reach targets :
T1 : 9632
T2 : 9460
In the upcoming sessions.
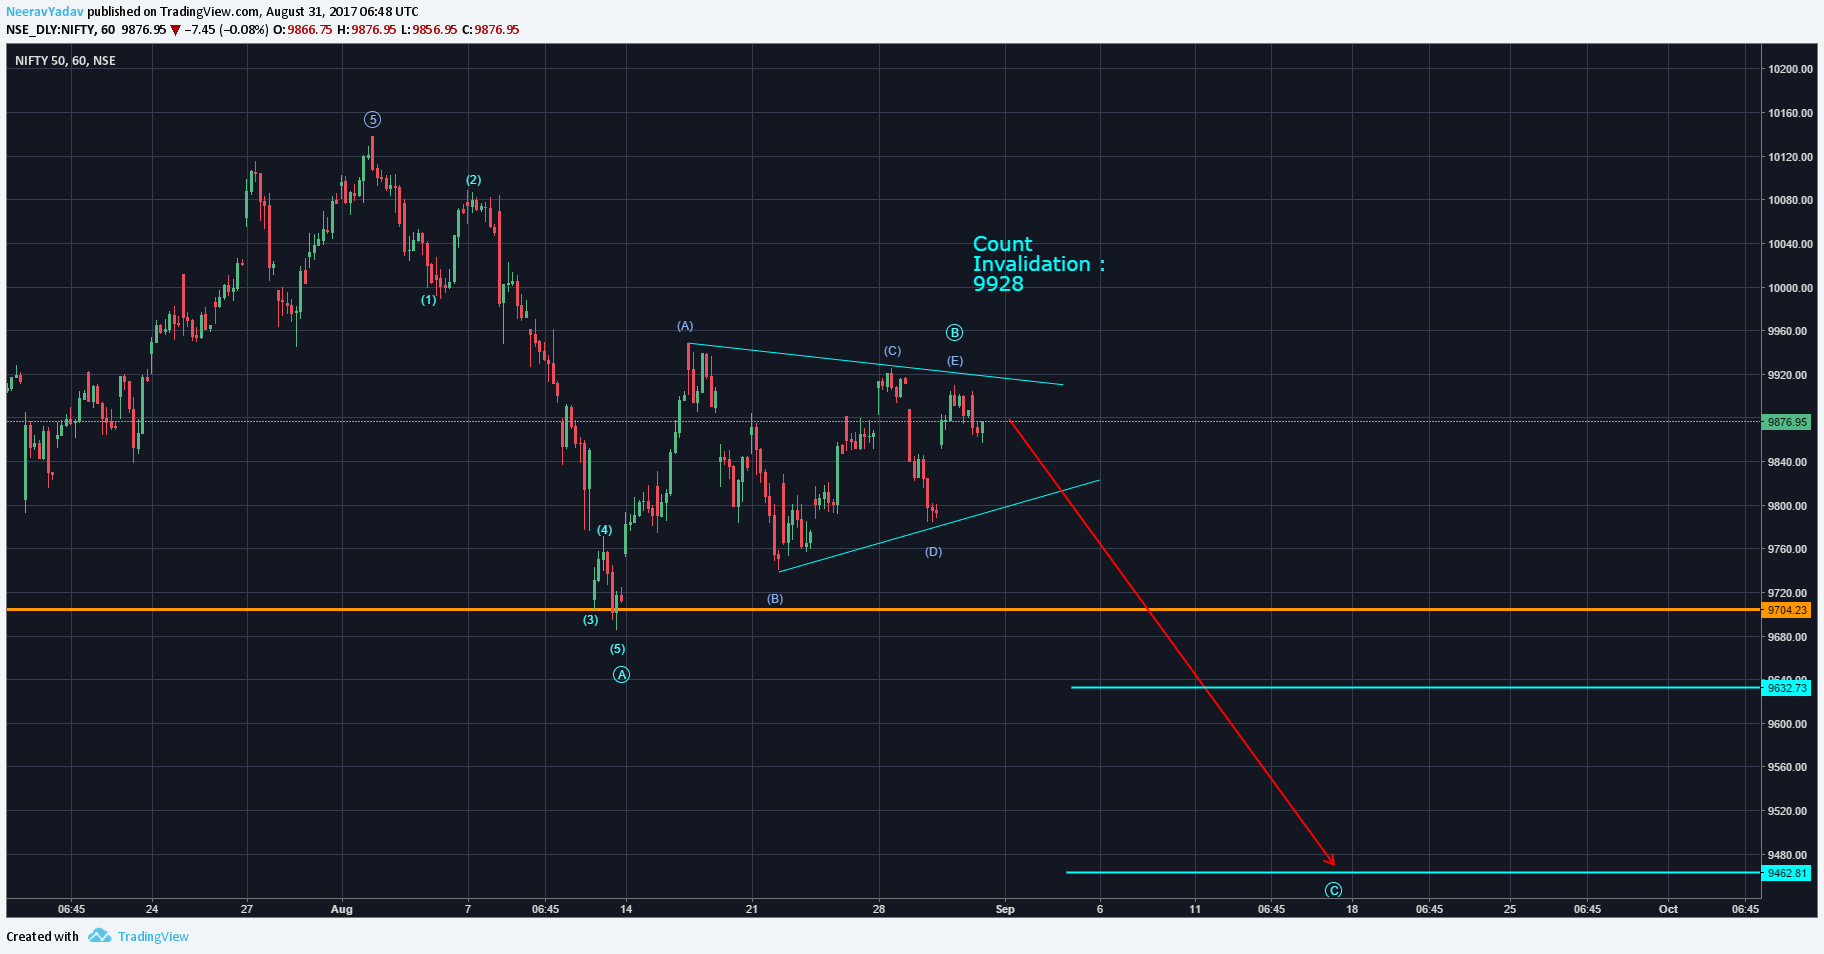
Nifty a possible traingle can lead to more downside (Elliott Wave Analysis)
I would also like to point out here that triangles can become more complex then expected and hence it might be possible that this structure might still be progressing, hence strict Stop Losses must be used and a less aggressive trading approach would be more suitable in this situation.
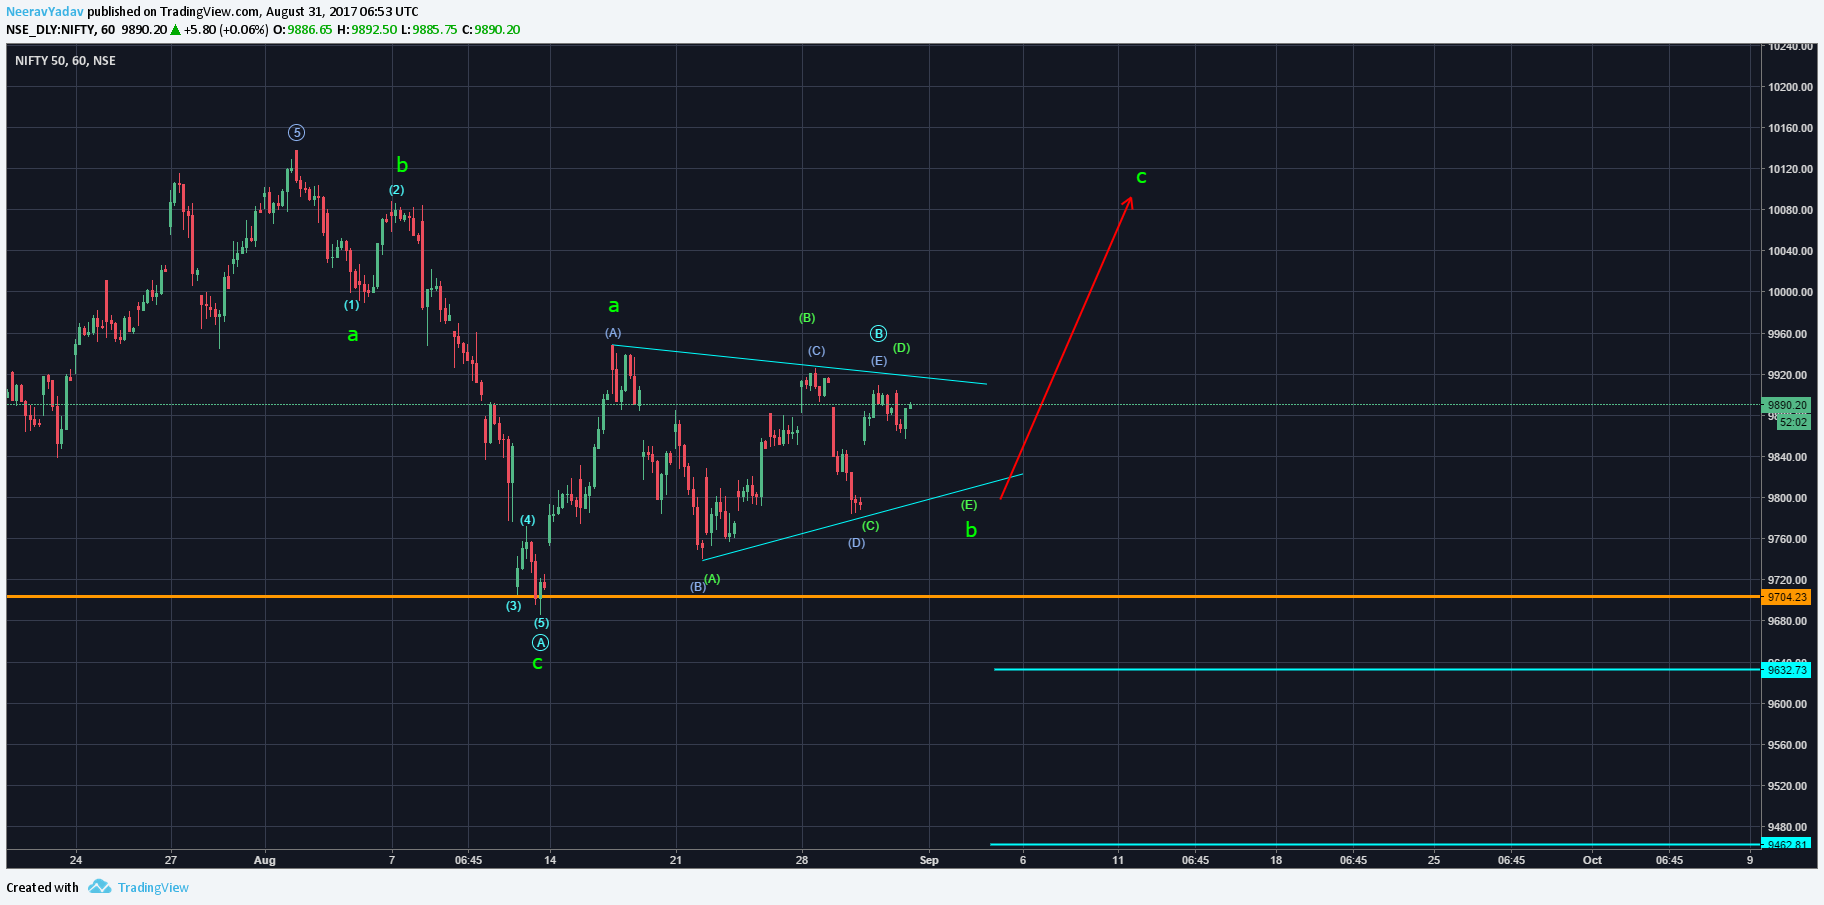
Low probability alternate Bullish count in Green.
My primary bias is Bearish but above is the alternate low probability Bullish Count for Nifty 50 in Green.
I will update further as this market progresses.
To receive these updates at the earliest you can subscribe to my Emailing List.
Learn to trade using Elliott Wave Principles – My Video Course
Disclaimer – All content presented here is strictly for educational purpose, do read the complete site disclaimer before taking any action.