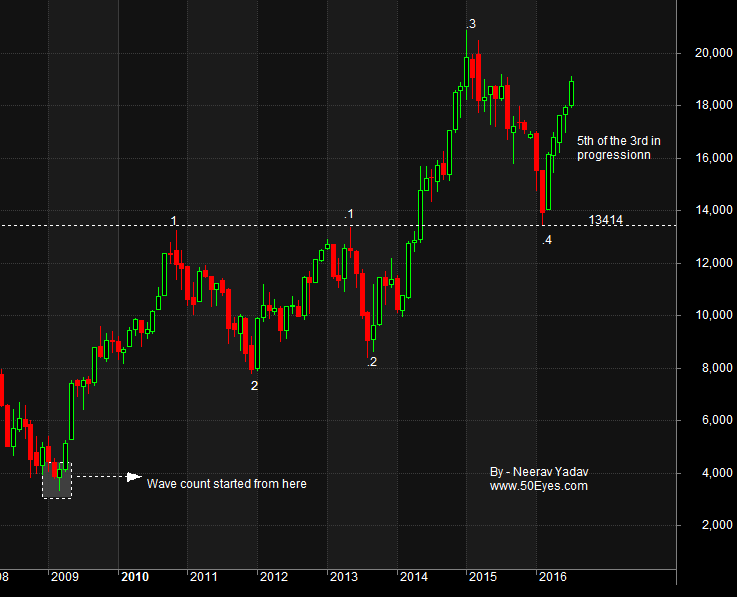
In this session I will be doing Elliott Wave Analysis of Bank Nifty ( An index of Indian Stock Markets ) and will be giving future targets for the same.
Chart used : Monthly, Candlestick.
Wave 1 : 3314 to 13303
Wave 2 : 13303 to 7766 (A little lower then the 50% retracement)
Wave 3 : In the variation that I will discuss here Wave 3 is still in progression.
And we will look for possible targets for the same.
In this count the 5th of the 3rd is in progression and the worst case scenario would be if it’s a failed 5th.
( As you must have noticed the count is very similar to that of Nifty, ready Nifty Elliott Wave Report. )
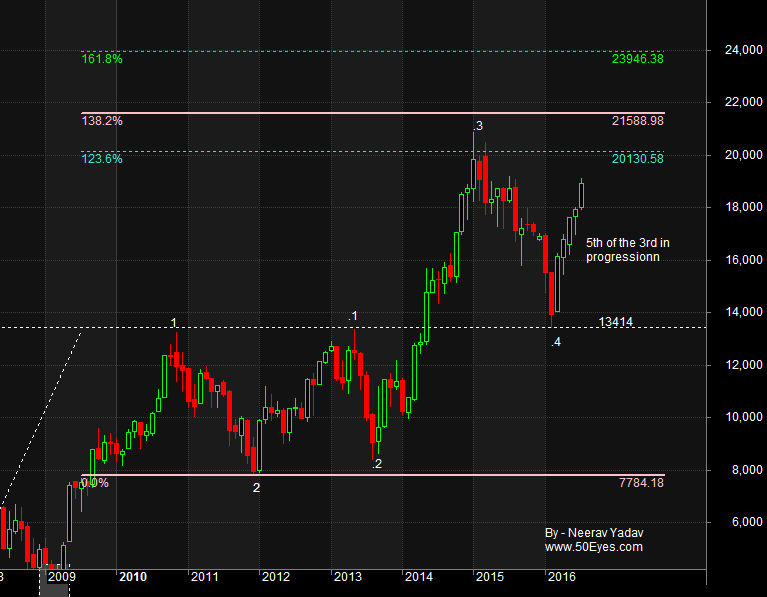
In that case it should atleast achieve the levels of 19850 – 20907 and that will also serve as target 1.
However in case Bank Nifty’s Wave 3 sustains above 20907 then we should see targets as 21588 and 23946.
These are the targets for scenario in which Wave 3 is a normal Wave, in case it is extended then we will see much higher levels such as 33900+ but that is something that we will see along the way and not now.
Also if the outlook of US markets specifically S&P 500 comes out to be as discussed in one of my previous report ( Report on S&P 500 ) then we would most certainly see targets above 20907.
Minimum Target : 19850 – 20907
Above 20907 : 21588, 23946
If Bank Nifty’s Wave 3 comes out as an extended Wave then even higher levels such as 33900+ are also possible but that we will see later on as the Wave develops.
Hence based on the above deduction I would like to conclude that an upside till the region of 19850 – 20907 should be seen and if things remain in favor of the bulls then even higher targets are possible.
It is also noteworthy that this analysis will be considered incorrect if Bank Nifty comes and sustains below the level of 13414.
Learn to trade using Elliott Wave Principles – My Video Course
Disclaimer – All content presented here is strictly for educational purpose, do read the complete site disclaimer before taking any action.


