How do traders identify a major move before it actually unfolds?
Is it just luck… or is there a repeatable structure behind market movements?
In financial markets like the SPX500, price movements often follow recognizable patterns. When those patterns are understood correctly, they can reveal high-probability trading opportunities.
In this case study, we will walk through a real trade in the SPX500 index, where a bearish market setup led to capturing 150+ points in a short trade.
👉 This trade was not only analyzed beforehand but also documented through live discussion and video analysis.
Market analyst Neerav Yadav, who has been forecasting financial markets for more than 10 years, has built a consistent track record through structured market analysis with a documented accuracy of over 80% across multiple forecasts.
This SPX500 trade is another example of how a clear hypothesis can translate into a real market opportunity.
Market Setup: When the Warning Signs Appeared
Before any trade is executed, the most important step is identifying when the market structure begins to change.
At the time of the analysis, the SPX500 index was trading around the 3955 level.
The key observation was simple:
👉 If the market broke below a critical support level, the probability of a larger downward move would increase significantly.
One specific level was being monitored closely: 3927
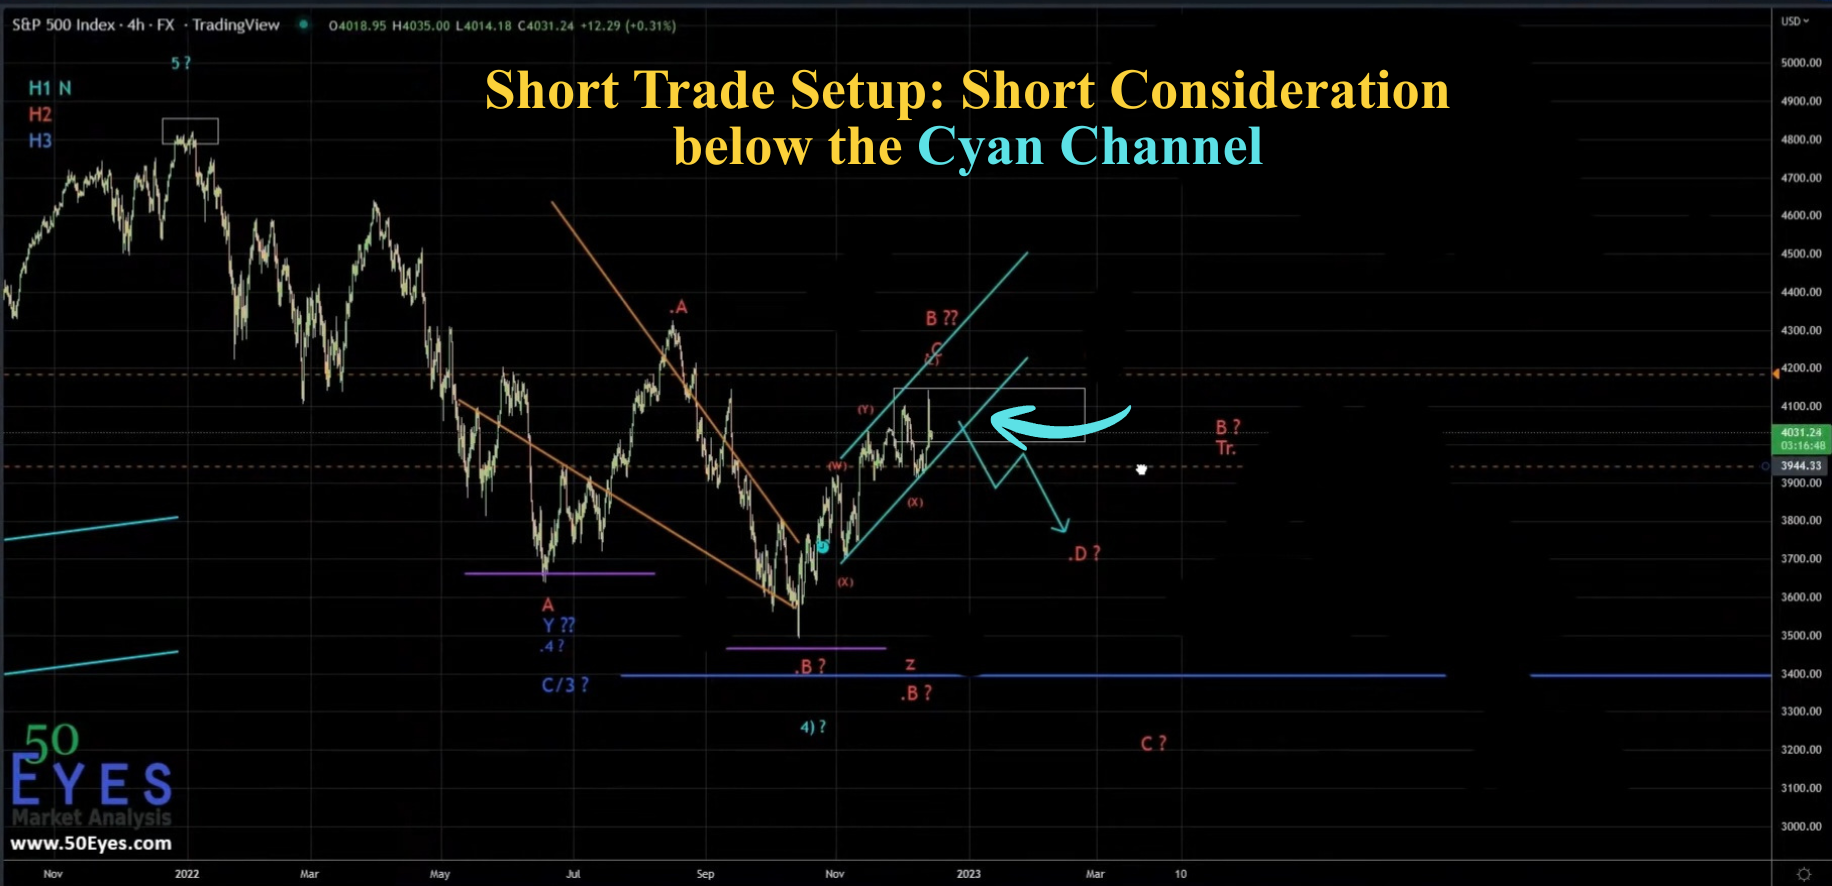
S&P 500 short trade consideration below cyan channel
The idea was straightforward:
- • If price stayed above it → market could continue sideways.
- • If price broke below it → strong selling pressure could begin.
This is where the trade setup started forming.
🎥 Video 1 – Hypothesis and the Start of the Move
What Happened Next?
Once the market broke below the monitored level, the scenario changed quickly.
Selling pressure increased, and the market started moving down rapidly.
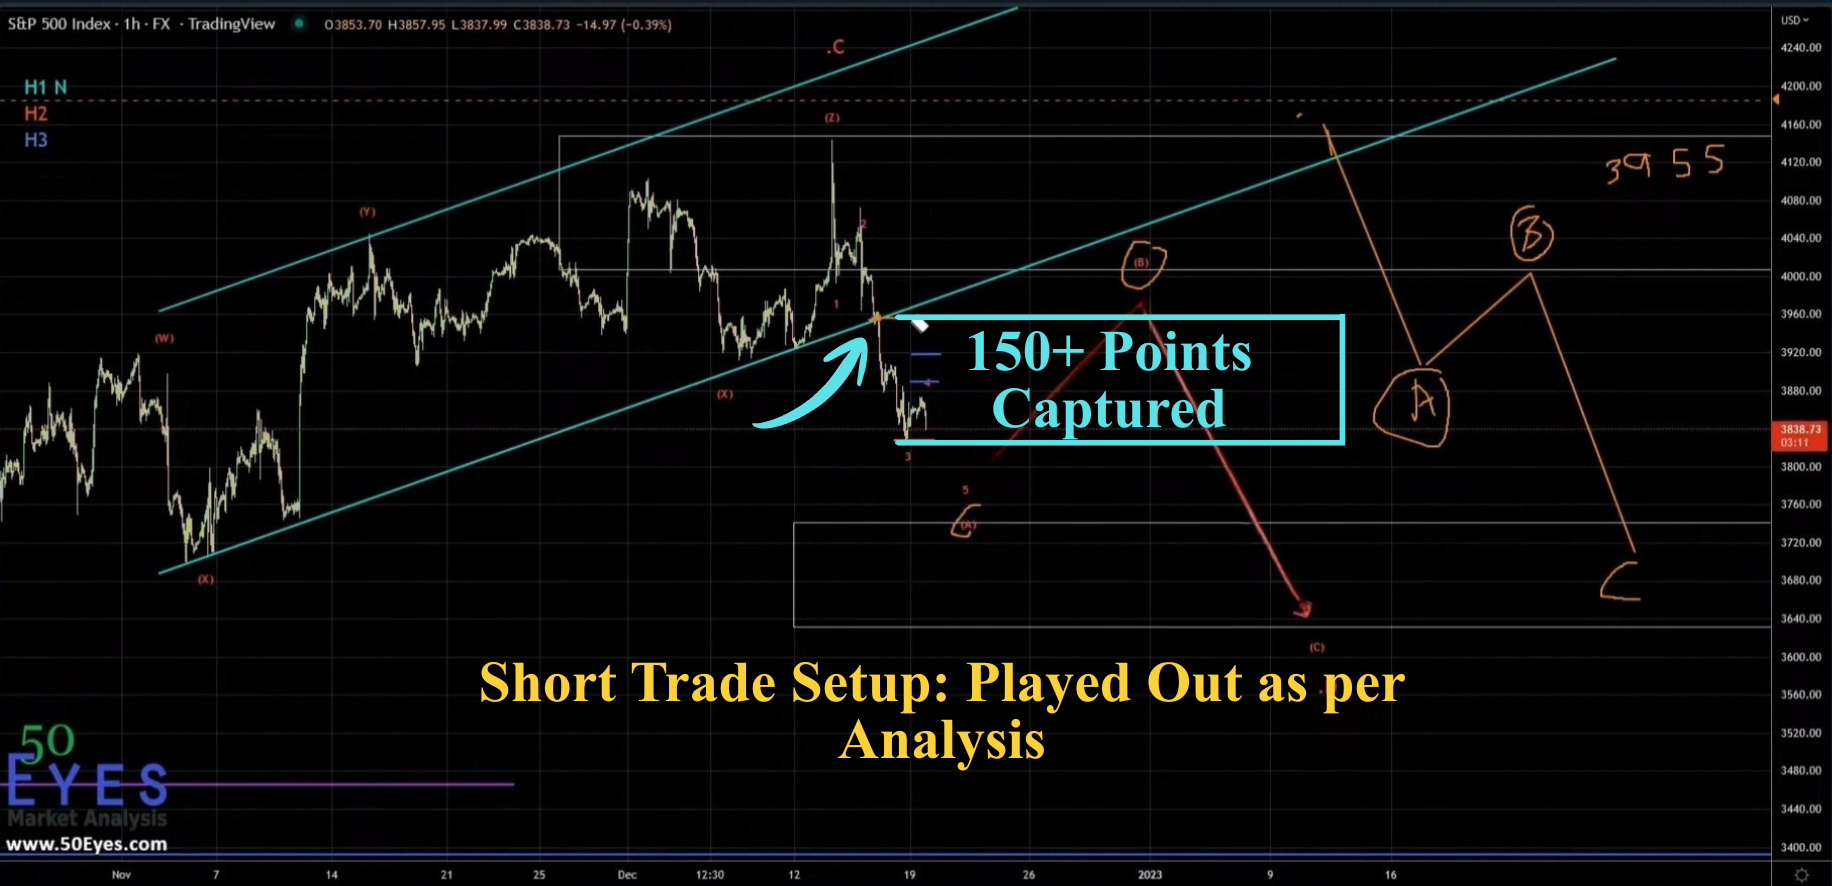
S&P 500 short trade setup played out capturing 150 points
The short position initiated around 3955 began to move in favor of the trade.
👉 As the decline accelerated, the move extended all the way toward 3890, allowing the trade to capture more than 150 points.
But this raises an important question.
Why Did the Market Move Like This?
Markets rarely move randomly.
Most of the time, price action develops in recognizable structural patterns.
In this case, the market was forming a Zig-Zag corrective structure.
👉 Understanding this pattern helped anticipate the continuation of the downward move.
🎥 Video 2 – Understanding the Zig-Zag Pattern
Simplifying the Zig-Zag Structure
A Zig-Zag correction typically follows a three-wave structure:
- Wave A – Downward move
This wave usually forms a five-wave decline, showing the initial selling pressure. - Wave B – Temporary bounce
A short recovery where the market moves upward briefly. - Wave C – Final decline
Another five-wave move downward that often completes the correction.
So in simple terms, the pattern looks like:
5 Down → 3 Up → 5 Down
During the analysis, the first wave already showed a clear five-wave decline:
- • 1 Down
- • 2 Up
- • 3 Down
- • 4 Up
- • 5 Down
Once this structure was visible, the expectation was that the market would continue lower, completing the Zig-Zag correction.
👉 This is exactly what unfolded.
Trade Outcome
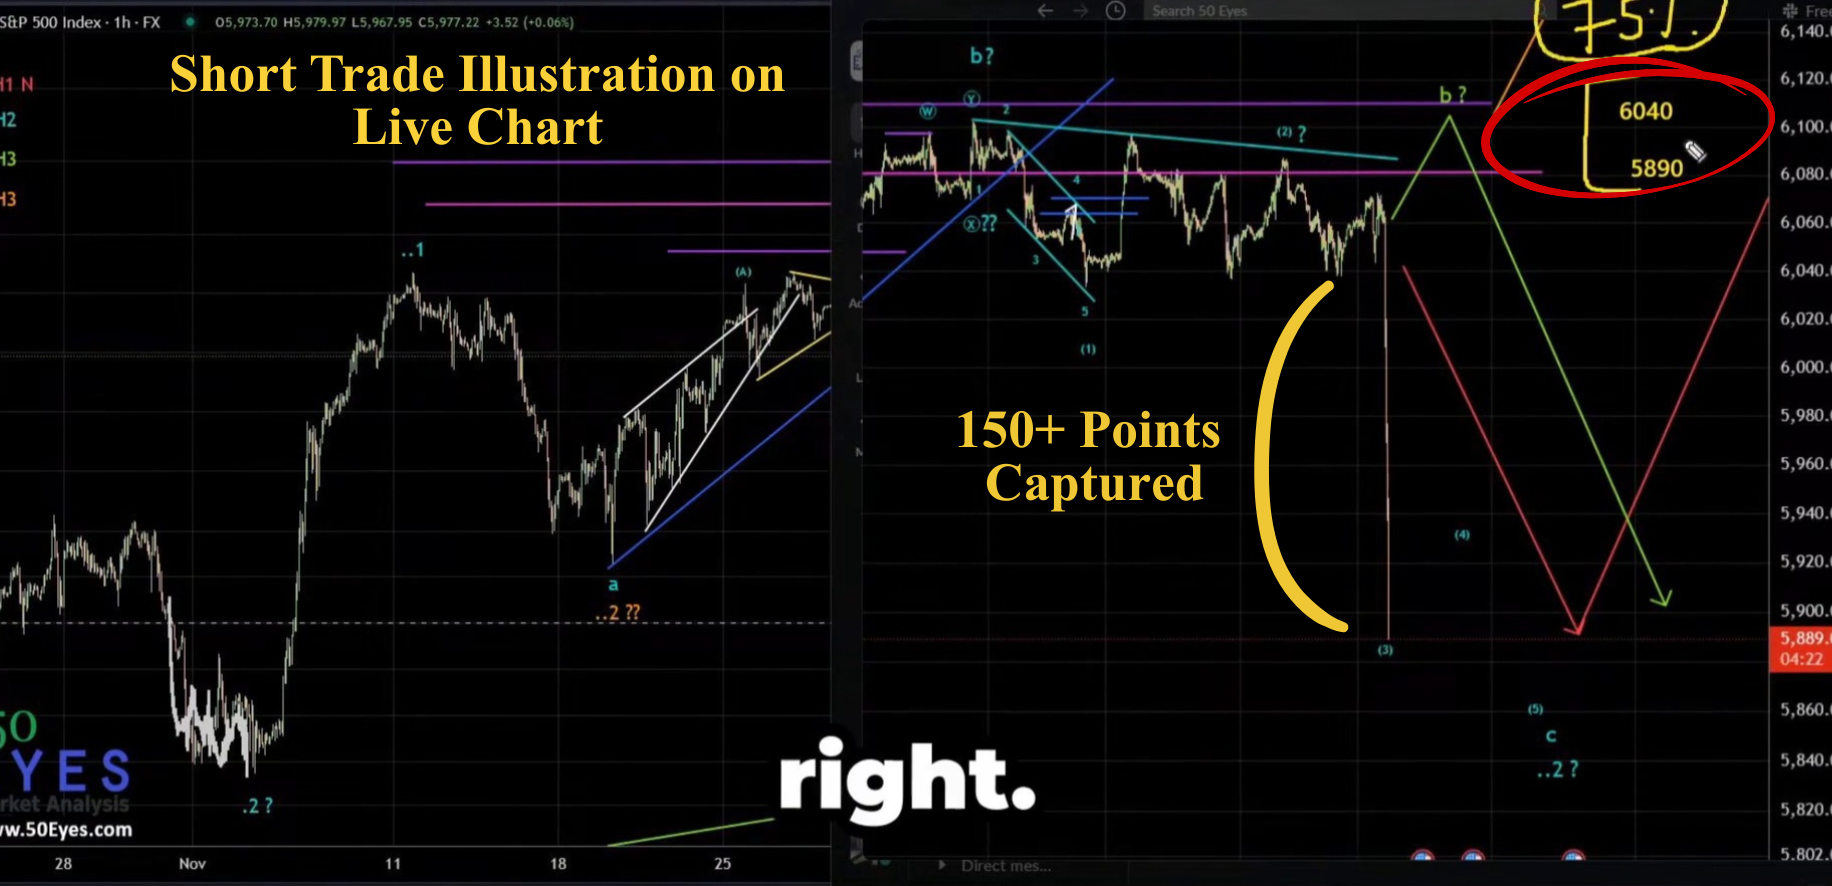
S&P 500 short trade of 150 points illustrated on chart
The trade developed as expected once the key level was broken.
- Entry: Around 3955
- Exit: Around 3890
👉 This resulted in a move of 150+ points captured in the short trade.
The trade was based on:
- • Clear market structure
- • A confirmed level break
- • Pattern recognition through the Zig-Zag formation
Key Lessons from This Trade
- 1. Market Structure Provides Direction
When price movements align with known patterns, they often reveal probable future moves. - 2. Important Levels Matter
The level around 3927 acted as a trigger point. Once broken, the market shifted decisively. - 3. Pattern Recognition Improves Timing
Identifying the Zig-Zag structure helped anticipate the continuation of the decline. - 4. Clear Hypothesis Leads to Better Trades
Rather than reacting emotionally, the trade was based on a pre-defined scenario.
Why Consistent Market Forecasting Matters
Anyone can point to charts after a move has already happened.
The real value comes from identifying the move before it unfolds.
Over the past decade, Neerav Yadav has focused on analyzing global markets using structural analysis and pattern recognition, achieving more than 80% forecasting accuracy across documented forecasts.
👉 Trades like this SPX500 example demonstrate how a disciplined analytical framework can uncover opportunities in fast-moving markets.
Related Market Forecast Case Studies
- Gold Market Forecast Case Study
- S&P 500 140+ Point Trade Case Study
- EUR/USD Forecast Case Study
- Crude Oil Market Forecast Case Study
Each case study shows how market structure, analysis, and execution come together in real trading situations.