What usually happens when a major resistance level breaks in the market?
Does the price simply move a little higher…
or can it trigger a large momentum rally?
And more importantly:
👉 Can such a move be anticipated before it actually happens?
In this case study, we examine a real market forecast on SPX500 (S&P 500 Index) where the key level identified was 6030.
At the time of the analysis, the market was trading near 5970, still below the breakout level. The expectation was clear:
👉 If the market breaks above 6030, a strong upward move could follow.
What happened next was a major breakout rally, with the market eventually reaching 6270, delivering a move of 354 points (5.89%).
But before we show the result, let’s first understand the reasoning behind the forecast.
Over the past 10+ years, market analyst Neerav Yadav has been forecasting global financial markets using structural technical analysis, maintaining a documented accuracy of over 80% across multiple market forecasts.
These forecasts are often shared in webinars and public recordings, allowing viewers to track them transparently.
👉 This SPX500 example is one such documented forecast.
Market Situation Before the Breakout
At the time of analysis, the SPX500 index was trading around 5970.
The key question was:
Was the market still stuck in consolidation, or was it preparing for a strong upward move?
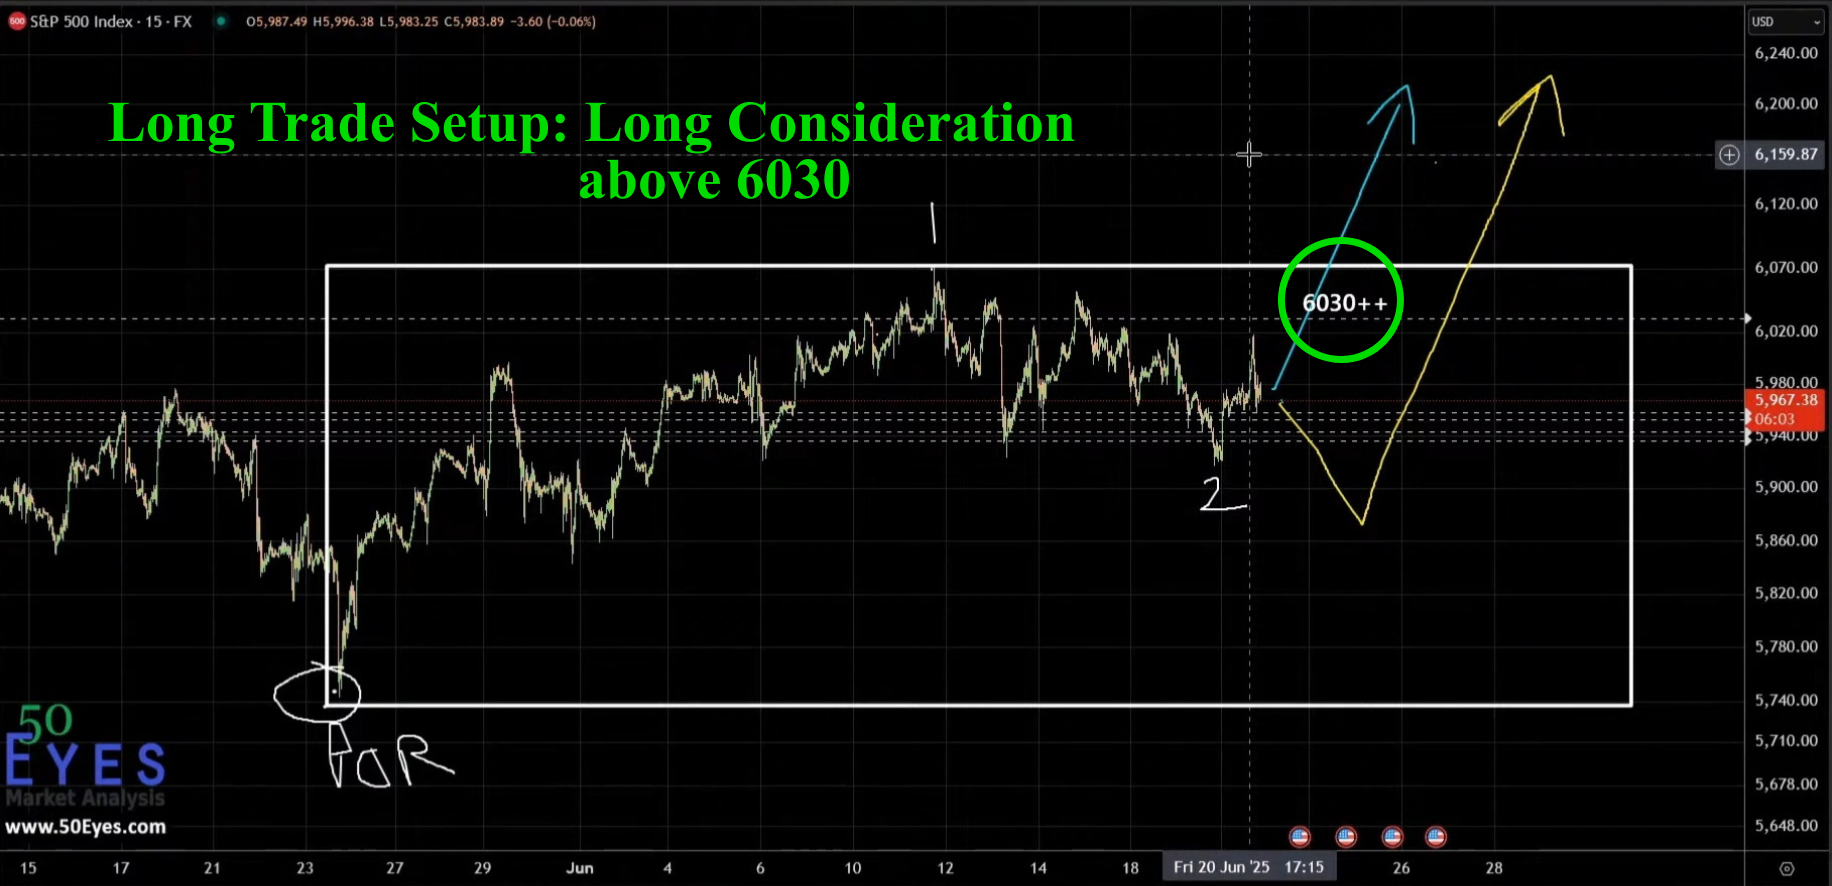
S&P 500 long trade setup above 6030 for wave 3
A critical price level stood out on the chart:
6030
👉 This level was identified as a trigger point for potential bullish momentum.
But why was this level so important?
🎥 Video 1 – Market Analysis and Breakout Hypothesis
Simplified Explanation of the Setup
During the webinar discussion, the analysis suggested the following structure:
- The market may have completed Wave 1 upward
- The ongoing movement looked like a Wave 2 sideways correction
- If this interpretation was correct, the next expected move would be another impulsive upward leg
However, confirmation was required.
That confirmation level was 6030.
👉 The trading plan was straightforward:
Above 6030 → Look for long opportunities on SPX500.
This level acted as a market trigger.
Now the question was:
Would the market actually break this level?
The Breakout That Triggered the Rally
Markets often test resistance multiple times before breaking out.
When SPX500 finally moved above 6030, the expected bullish scenario started playing out.
👉 Momentum quickly entered the market.
🎥 Video 2 – Live Chart Showing the Result
As the breakout unfolded, the index continued climbing steadily.
Eventually the market reached 6270, creating a move of:
- 354 points
- 5.89% upward movement
For a major index like SPX500, this represents a significant directional move.
Visual Proof of the Entire Move
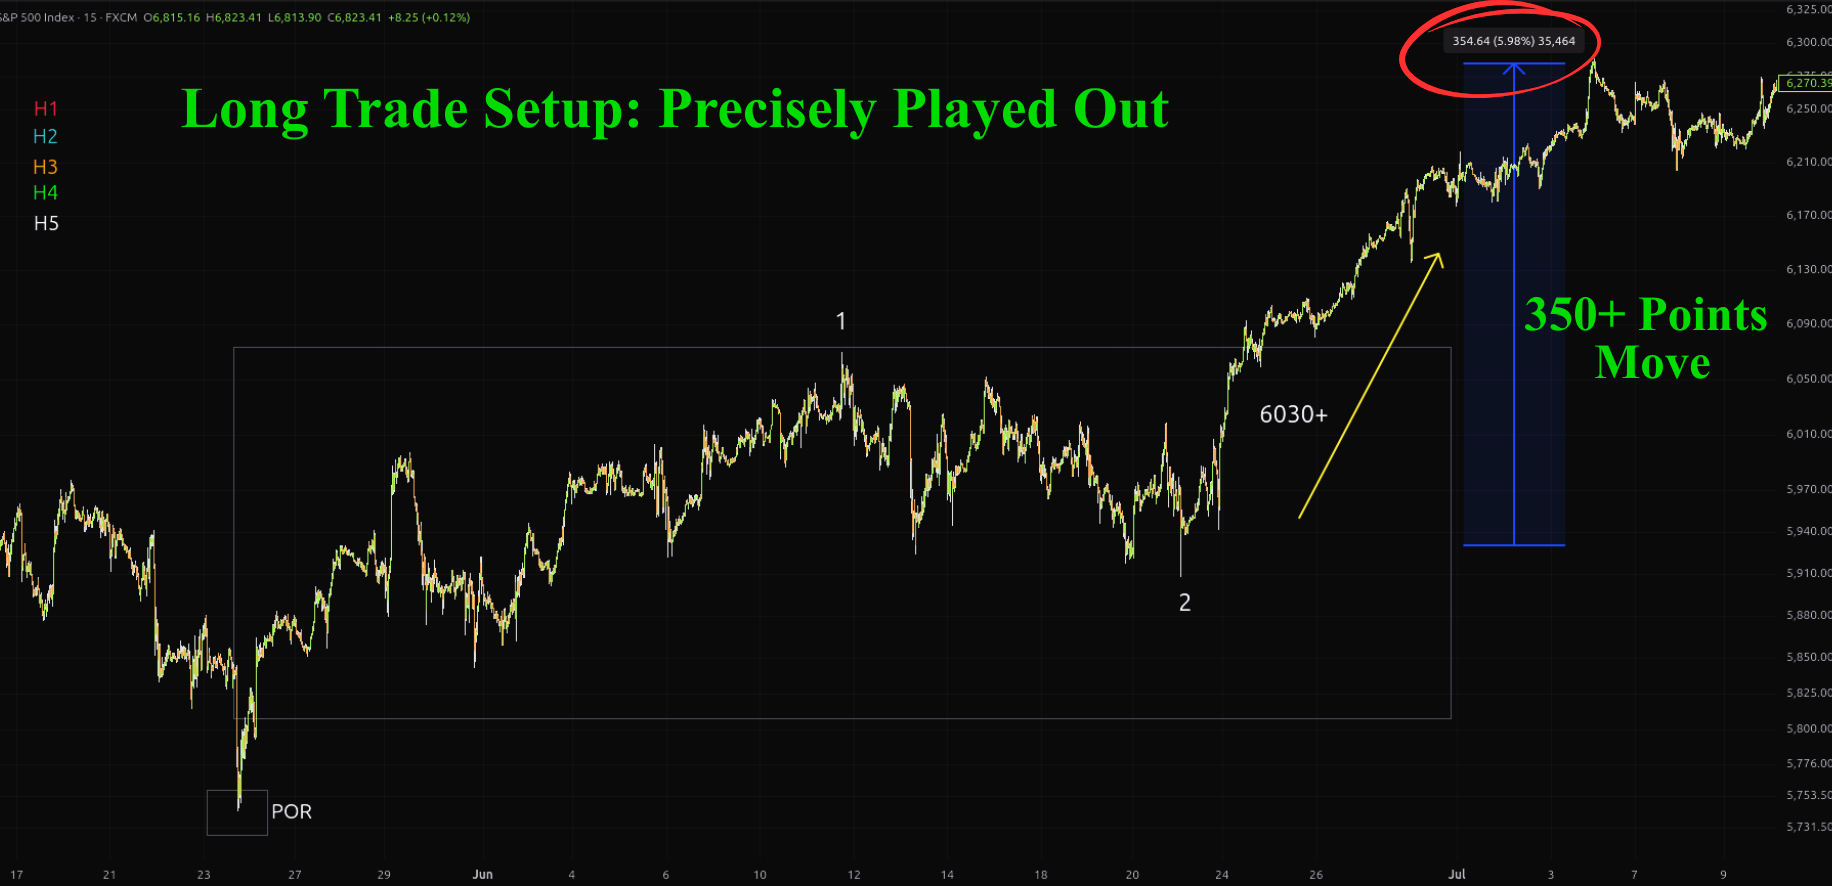
S&P 500 long trade setup played out precisely, 360 points move
“SPX500 breakout above 6030 leading to 354 point rally”
- The breakout level near 6030
- The strong continuation higher
- The eventual move toward 6270
👉 This visual evidence helps demonstrate how technical levels can act as powerful catalysts for market movement.
Why the 6030 Level Was So Important
Many traders focus on small price movements, but professional market analysis often revolves around key structural levels.
In this case, 6030 acted as a confirmation point.
Once the market moved above this level:
- Market sentiment shifted
- Momentum traders entered
- • Short sellers were forced to cover
👉 These combined factors helped fuel the strong rally that followed.
Key Lessons from This SPX500 Forecast
- Key Levels Drive Market Movement
Breakouts above important levels often trigger strong directional moves. - Structure Helps Identify High-Probability Scenarios
Understanding the broader market structure can provide early signals of potential momentum moves. - Confirmation Improves Trade Timing
Rather than predicting blindly, waiting for confirmation levels like 6030 can improve trading decisions. - Documented Analysis Builds Credibility
Forecasts that are recorded before the move happens provide transparency and accountability.
Why Structured Market Forecasting Matters
Financial markets often appear unpredictable on the surface.
But when viewed through the lens of market structure, momentum levels, and technical triggers, patterns begin to emerge.
For over a decade, Neerav Yadav has been applying this structured analytical approach to multiple global markets including:
- Stock indices
- Commodities
- Currency markets
With more than 10 years of experience and a documented accuracy exceeding 80%, these forecasts aim to identify high-probability market scenarios rather than random speculation.
👉 The SPX500 breakout above 6030 is a clear example of how a single technical level can unlock a major market move.
Related Market Forecast Case Studies
Explore other documented forecasts:
- Gold Market Forecast Case Study
- EUR/USD Market Analysis Case Study
- Crude Oil Market Forecast Case Study
- S&P 500 Short Trade Case Study (140+ Points Captured)
These case studies demonstrate how the same analytical framework can be applied across different asset classes.