How often do markets actually respect technical levels?
And more importantly…
👉 Can a simple structural setup really signal a strong move before it happens?
Many traders spend hours analyzing charts yet still struggle to identify high-probability opportunities.
But sometimes the market gives a setup that is so clear that ignoring it would be the bigger mistake.
That is exactly what happened in this SPX500 market forecast case study.
In this example, a clear support level near 5544 helped anticipate a two-leg upward move, which later resulted in an 80+ point trade opportunity.
👉 This forecast was discussed during a webinar and later confirmed by the actual market movement on the live chart.
For over 10 years, market analyst Neerav Yadav has been studying global financial markets using structured technical analysis and market wave behavior.
Across multiple forecasts in indices, commodities, and forex markets, his analysis has maintained more than 80% forecasting accuracy.
Let’s break down how this particular SPX500 setup developed.
Understanding the Market Situation
At the time of the discussion, the SPX500 index was trading close to a strong structural support area.
This zone was important because the market had already completed a corrective phase and appeared to be holding a key support level.
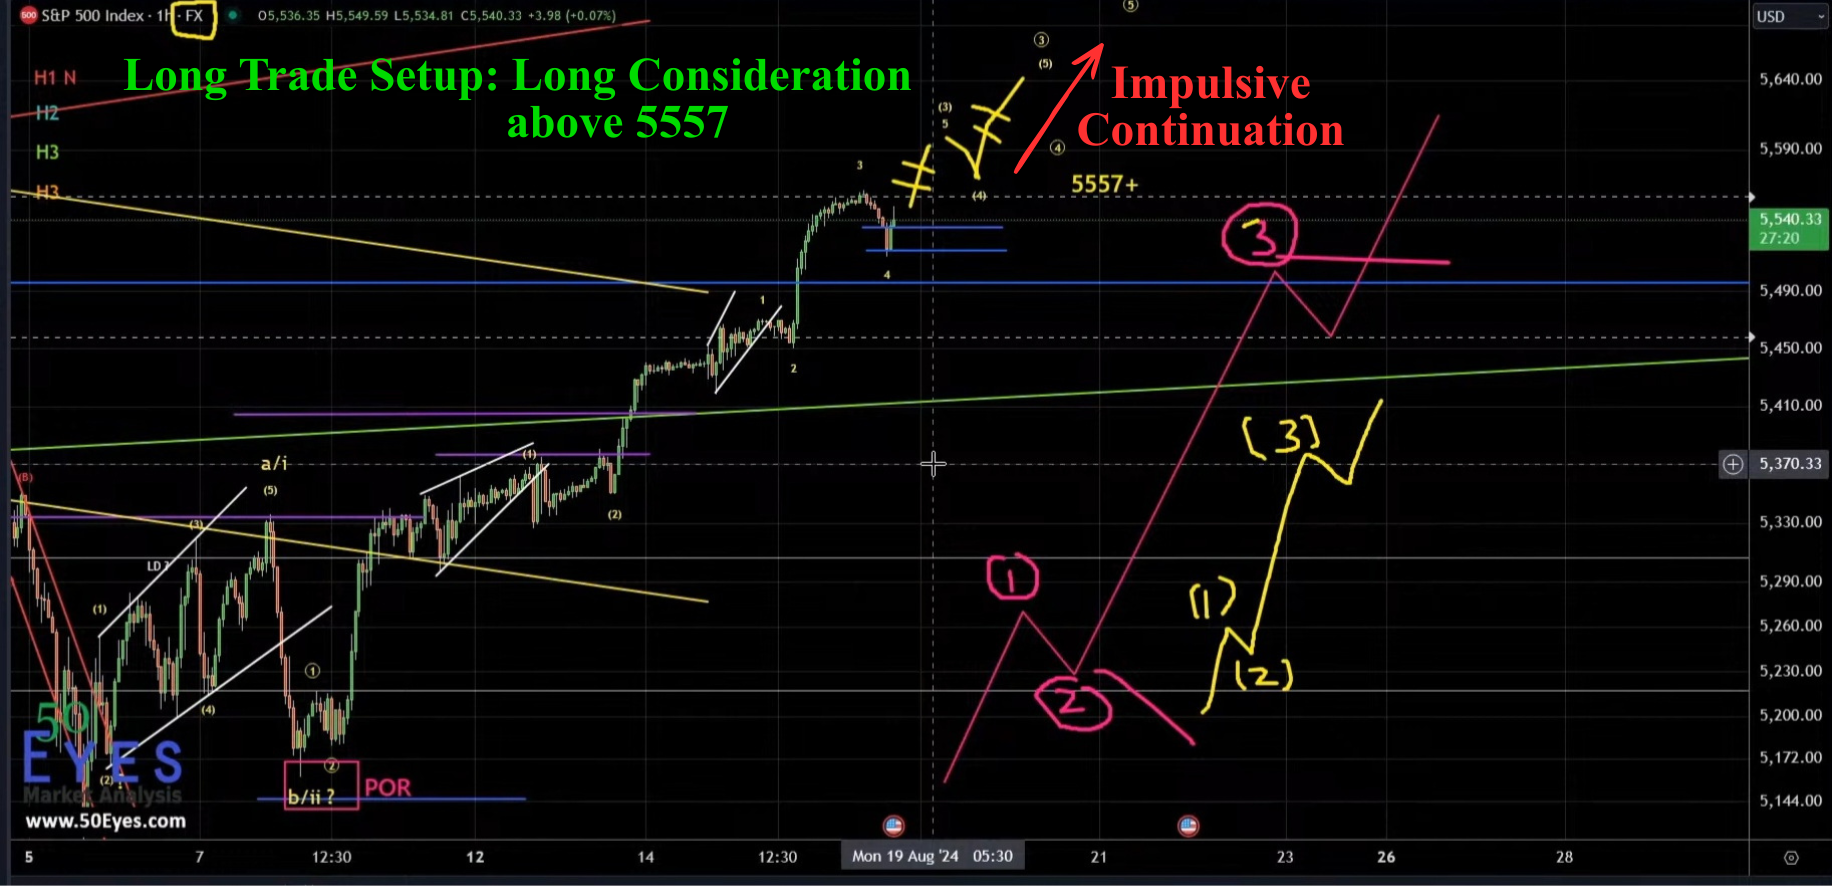
S&P 500 long trade setup above 5557
The main question at that moment was:
Would the market break down from support, or was it preparing for a new upward leg?
👉 Instead of a breakdown, the market was showing signs of strength near support, which increased the probability of a two-leg upward move.
The Hypothesis: Two Legs Up from Support
🎥 Video 1 — Market Setup Discussion
During the analysis, the structure of the market suggested that the support near 5544 was holding firmly.
Instead of weakness, the price action indicated the possibility of two upward legs, often seen when the market completes a corrective phase and begins a new impulsive move.
The idea was simple:
- If support holds near 5544
- The market could move upward for wave (3)
- Followed by another leg for wave (5)
This projected move suggested that the market could reach 5600+ levels.
To visualize the expected move, two yellow arrows were drawn on the chart indicating the potential upward structure.
The conservative long entry level was placed above 5557.
But analysis alone does not prove anything.
The real question always comes next.
Did the Market Actually Move as Expected?
Technical analysis often looks convincing on paper.
But markets only validate a forecast when price actually moves.
So what happened after the discussion?
The Result: A Strong Upward Move
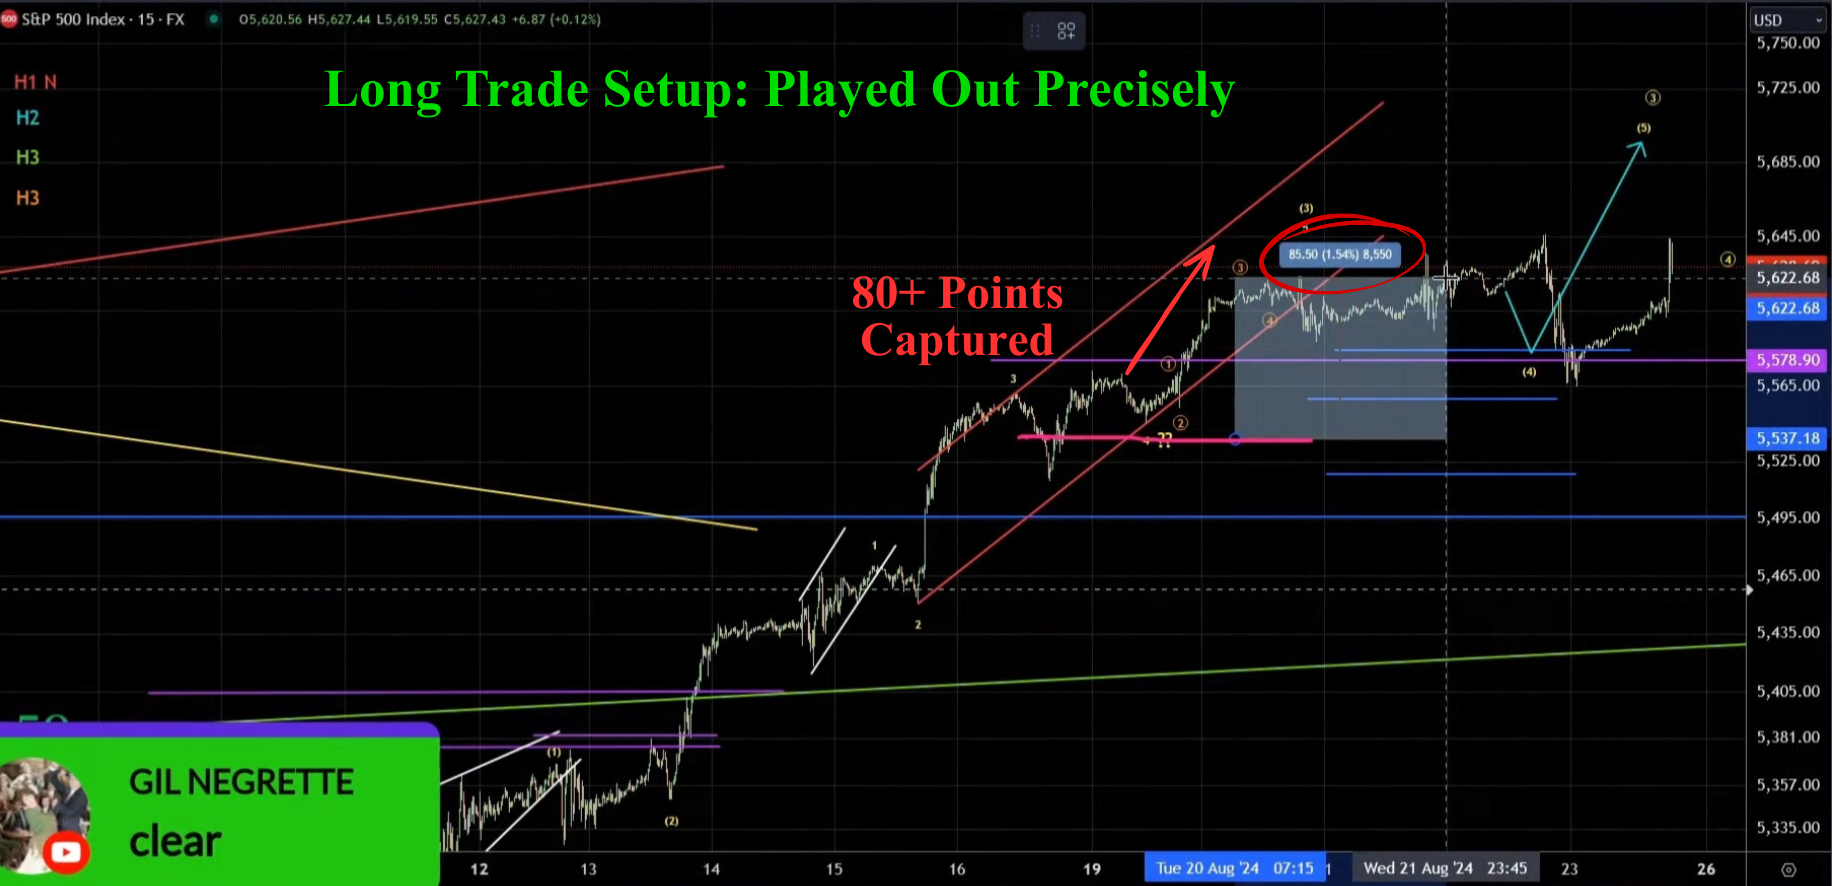
S&P 500 long setup played out precisely capturing 80 points move
🎥 Video 2 — Live Chart Result
At the time of the webinar discussion, the SPX500 price was near 5540.
As the market progressed, the upward movement unfolded almost exactly as anticipated.
Eventually, the price reached around 5627.
This resulted in:
- Total move: roughly 100+ points
- Clear tradable move: around 80–86 points
👉 This move confirmed the earlier expectation that the market could produce two upward legs from support.
For traders who positioned themselves according to the analysis, this created a strong opportunity to capture a directional move in the index.
Why This Setup Was Important
This SPX500 case study highlights an important concept in trading:
👉 Markets often move in structured waves rather than random movements.
In this situation:
- 1️⃣ A clear support level was identified
- 2️⃣ The expected two-leg upward structure was discussed
- 3️⃣ The market later delivered a strong directional move
This is exactly the kind of setup professional traders look for — situations where risk is defined and the reward potential is clear.
Key Lessons from This SPX500 Trade
- Support Levels Matter
Markets often react strongly from well-defined support zones. - Structure Improves Forecasting
Recognizing wave structures can help anticipate future price movement. - Simplicity Works
Sometimes the most effective setups are also the simplest — support holding and price moving higher. - Confirmation Through Price
Forecasts gain credibility only when price confirms the analysis.
The Bigger Picture
This SPX500 forecast is not an isolated example.
For over a decade, Neerav Yadav has analyzed multiple markets including:
- Global stock indices
- Commodities such as gold and crude oil
- Major forex pairs
Using a combination of market structure analysis and wave behavior, his forecasts have consistently aimed to identify high-probability market moves before they unfold.
With more than 10 years of market experience and over 80% forecasting accuracy, many of these market discussions are documented through webinars and live analysis sessions.
Final Thoughts
Every trader asks the same question:
👉 Is it possible to identify market moves in advance?
While no analysis method can predict markets perfectly, structured approaches can significantly increase the probability of being on the right side of the trade.
In this SPX500 case study, a simple observation — support holding near 5544 — helped anticipate a two-leg upward move toward 5600+ levels.
👉 The result was a clear directional move of over 80 points, demonstrating how disciplined analysis can translate into real trading opportunities.
Related Market Case Studies
Explore more documented forecasts:
- Gold Market Forecast Case Study
- S&P 500 Bearish Trade Case Study (140+ Points Captured)
- EUR/USD Market Forecast Case Study
- Crude Oil Technical Analysis Case Study
These examples show how the same analytical framework is applied across multiple global markets.