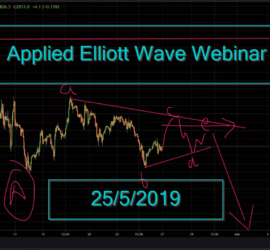
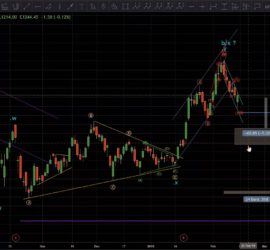
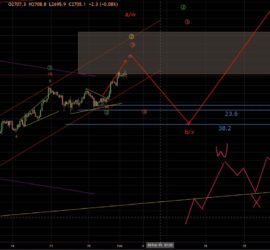
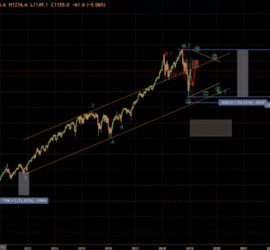
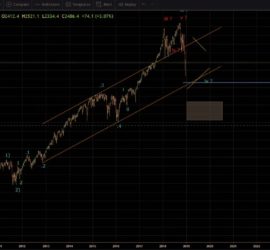
6. Applied Elliott Wave Webinar (Crude, Gold, SPX, RTY, Nifty 50, TSX, NSE Stocks : Tech Mahindra, Maruti, Britannia, ICICI Bank) 25/5/2019
This Elliott Wave Webinar was conducted live on 25th May, 2019 and broadcasted simultaneously on Youtube. Elliott Wave Outlook for Crude Oil, Gold, SPX, E mini Russell 2000, Nifty 50, TSX Composite (Canadian Stock Market Index), Tech Mahindra (Indian Stock), Maruti (Indian Stock), Britannia (Indian Stock) & ICICI Bank (Indian […]