In my previous post I looked at both the bullish as well as the bearish possibility and pointed out that if the market takes support over the 1244 mark then that would increase the possibility that the bullish count will play out.
As of now the market has clearly taken support over the 1244 mark and hence I believe that the current leg up from 1194 was the Wave 1 of Wave 3.
As of now I believe that the market will face resistance near the 1260 region and then reverse uptill 1230-1224.
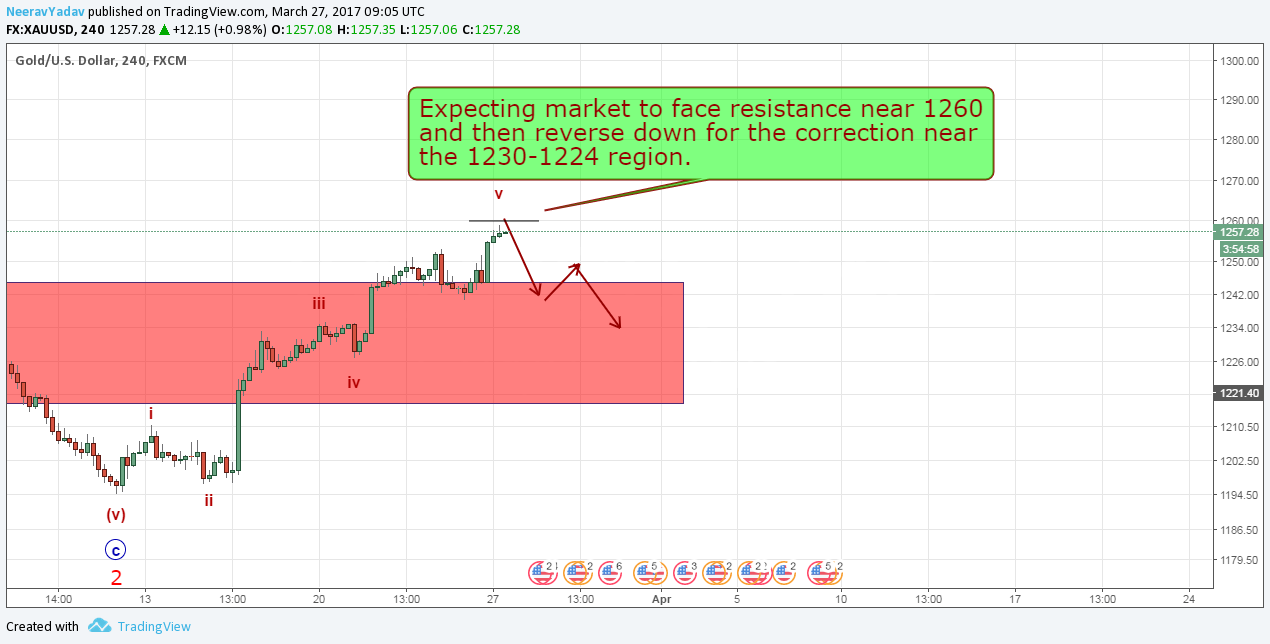
Gold Elliott Wave Analysis 27th March 2017 onwards
If the market further holds the 1230 as support then that wold be the start of the next leg up and will confirm my current view.
I will update with further targets once the market makes the wave count more clear.
Learn to trade using Elliott Wave Principles – My Video Course
To receive these updates at the earliest you can subscribe to my Emailing List.
Disclaimer – All content presented here is strictly for educational purpose, do read the complete site disclaimer before taking any action.