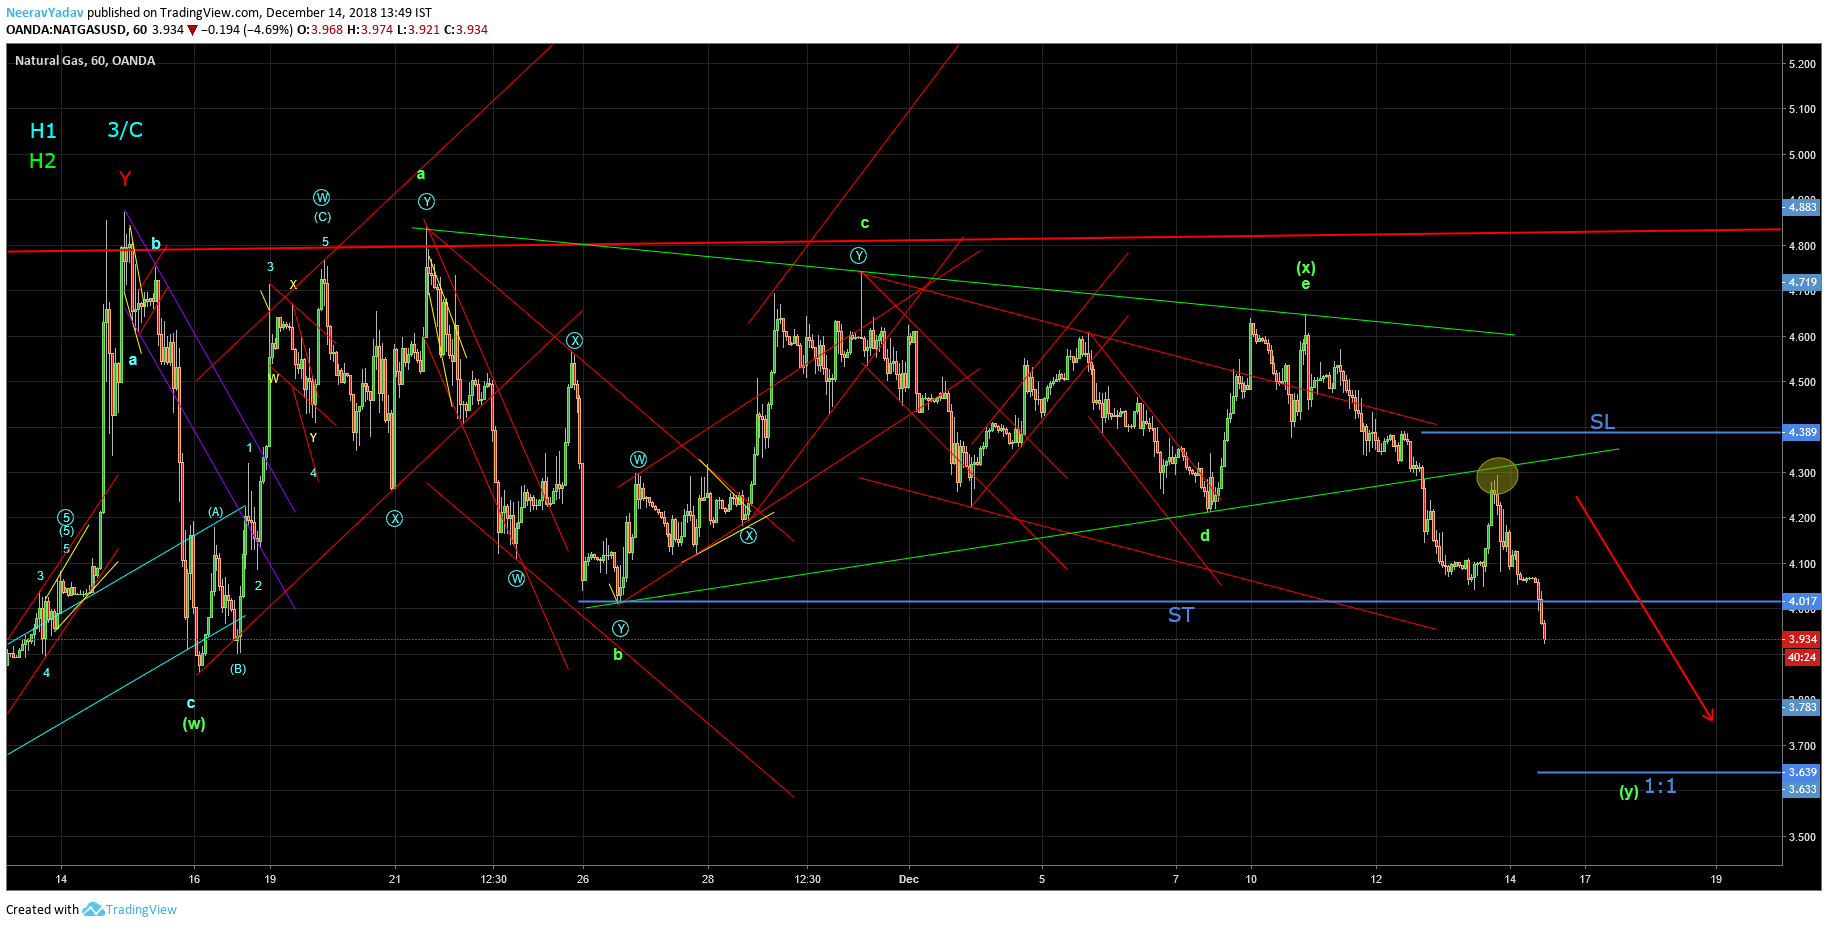
Natural Gas : 1H : The (w)-(x)-(y) type of correction which is represented by the Green Hypo 2 looks to be in the final stages.
The retest of the b-d trendline was the indication for the upcoming down move and an early entry, the shorts were confirmed later with the move below W.b low.
Strategy : Existing shorts should hold for lower levels upto 3.639 which is also the level where W.(w) = W.(y) , once we see a reversal near that level we can look for possible long trading opportunities.
Natural Gas 14th December, 2018 onwards (Elliott Wave Count)
2017 forecast accuracy 87.5% : Track Record
Details regarding one to one training : Click Here
Get 1 month free entry to the private group and learn to trade using Elliott Wave Principles – Video Course
To receive these updates at the earliest you can subscribe to my Emailing List.
Disclaimer – All content presented here is strictly for educational purpose, do read the complete site disclaimer before taking any action.