In this video Report I have done a detailed Elliott Wave Analysis of Gold (XAU/USD), discussing the current double Zig Zag correction to the upside which seems to be now in Wave C of the second Zig Zag.
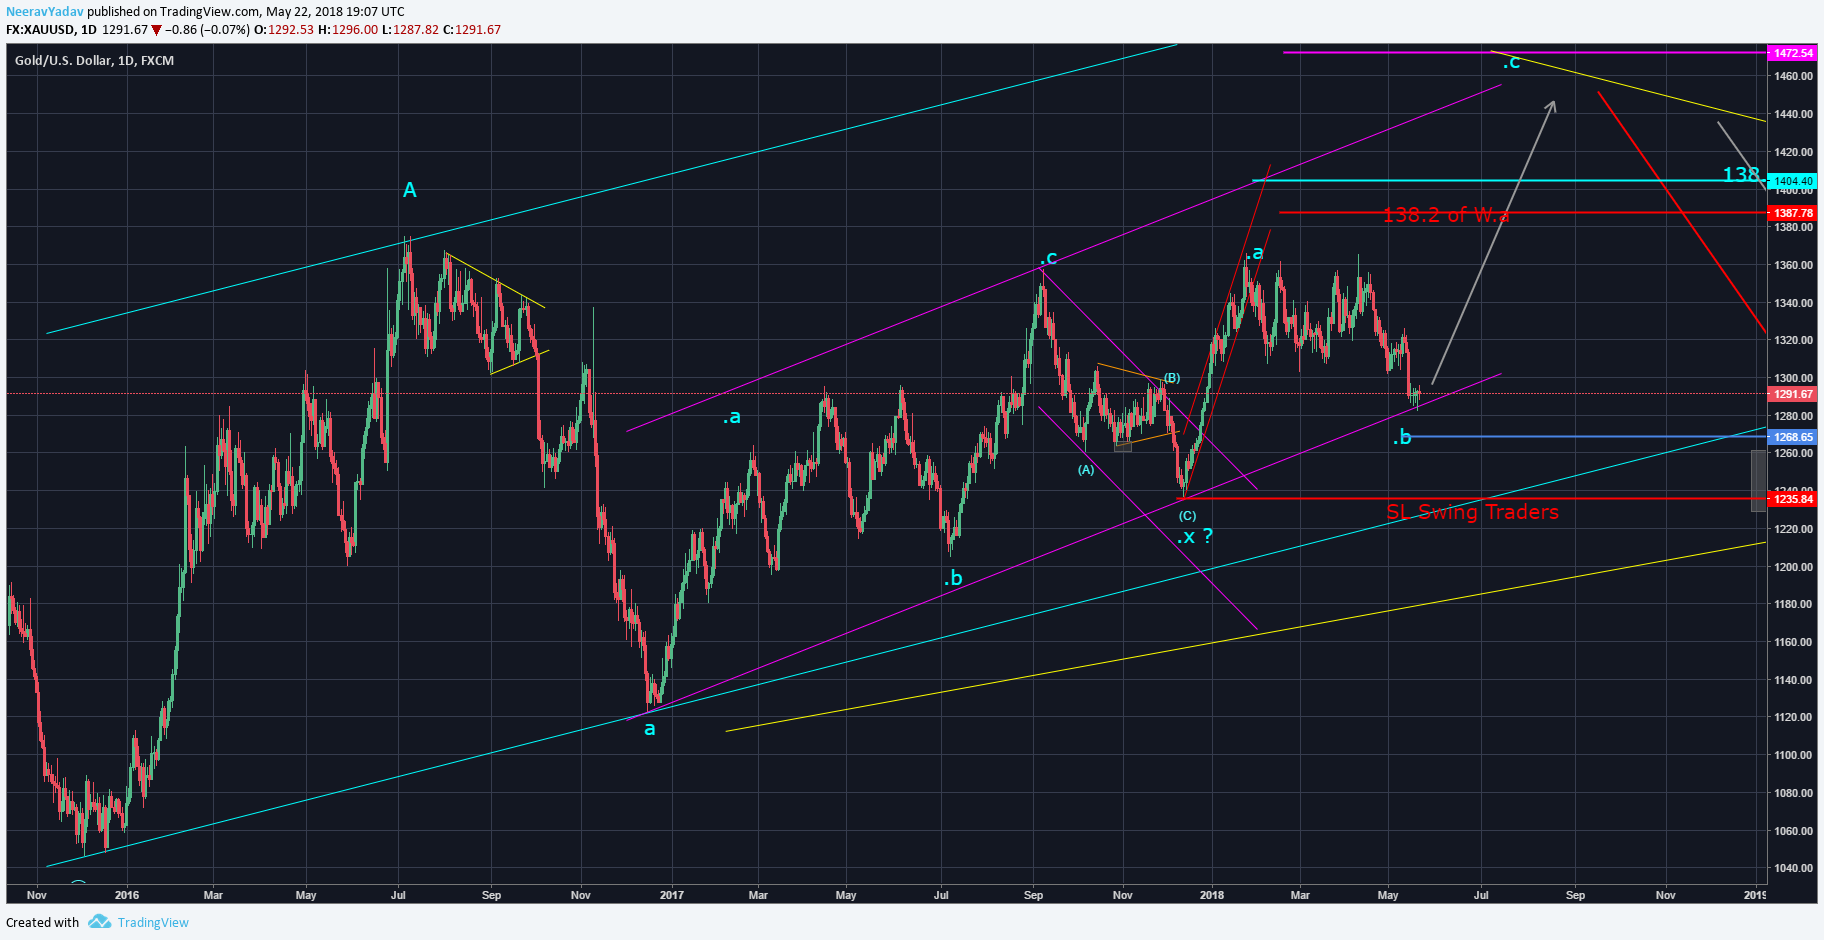
Gold Daily chart 23rd May, 2018 with Double Zig Zag correction to upside and Stop Loss below Wave x low
If this analysis plays out as expected then we can see upside levels of 1400 – 1470, if not then the Stop Loss for swing trading would be below 1235 low and for short term Intraday traders it would be low of the swing or end of Wave .b that is below 1281 level.
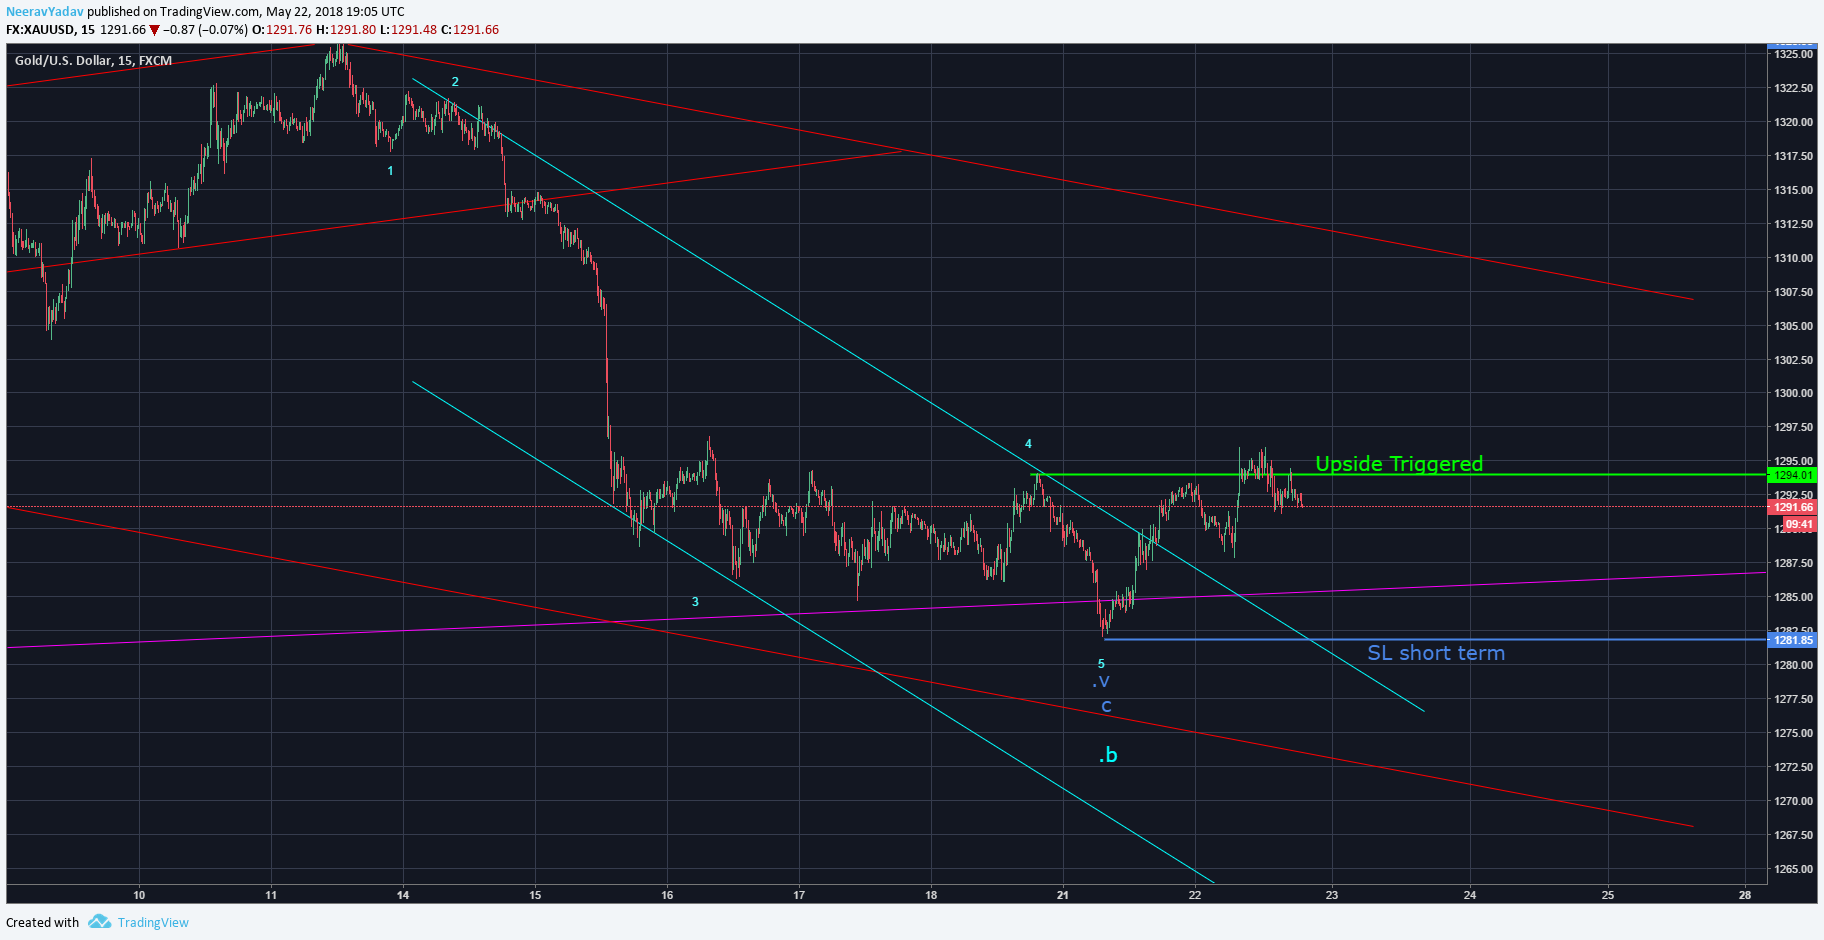
Gold 15 min chart Upside Triggered
Watch the complete video report for a detailed view :
Details regarding one to one training : Click Here
Get 1 month free entry to the private group and learn to trade using Elliott Wave Principles – My Video Course
To receive these updates at the earliest you can subscribe to my Emailing List.
Disclaimer – All content presented here is strictly for educational purpose, do read the complete site disclaimer before taking any action.