What Happens When Market Structure and Execution Align?
Gold trading is often described as unpredictable.
Fast moves.
Sharp reversals.
Emotional traders.
But here’s the real question:
What if the move isn’t random?
What if it’s part of a larger structural roadmap?
This case study walks you through a complete gold market trading cycle — from structured forecasting to real trade execution — where two long positions together captured 166 points in XAUUSD.
Not theoretical targets.
Not hindsight chart drawing.
Actual executed trades.
The Bigger Context: Why We Were Looking for Longs
Before the week even began, directional bias was discussed in our prior webinar.
Using Elliott Wave structure and multi-timeframe market forecasting, the broader gold cycle suggested bullish continuation — provided key structural levels held.
Instead of reacting to every candle, we asked:
- Where are we in the current impulse wave?
- Has correction completed?
- Is the market preparing for expansion?
The structure suggested strength above trigger levels.
That’s where opportunity begins — not at the breakout, but at structural confirmation.
With over 10+ years of continuous forecasting experience across gold, indices, euro, crude oil and other markets — maintaining a documented analytical accuracy close to 80% — the focus has always remained the same:
Structure first.
Execution second.
🎥Live Trade Discussion Inside Slack Group
This clip shows the real-time trade discussion and planning.
In this clip, you can see:
- The exact entry level discussed
- Target planning
- Stop-loss positioning
- Real-time confirmation
Trade 1 — The First Long Setup Develops
As gold respected the structural level, the first long trade was initiated.

GOLD long trade entries and exits illustration
 Entry 1: 4168.5
Exit 1: 4213
≈ 50 points captured
This wasn’t a blind entry.
The trade was shared and discussed live inside our private Slack trading group.
Stop loss was defined.
Risk was controlled.
Target was projected based on wave expansion.
Once 4213 was achieved, profits were booked as planned.
Clean. Structured. Executed.
🎥Visual Chart Breakdown of Entry & Exit Points
This video shows:
- Entry 1 at 4168
- Entry 2 at 4242
- Exit near 4359
- Percentage move (1.21% + 2.74%)
- Total points calculation
50 points + 116 points = 166 points captured in actual trades.
Not analysis.
Execution.
Trade 2 — Continuation Within the Same Bullish Structure
After the first move completed, gold did not collapse.
Instead, structure indicated continuation.
The impulse wave had room to expand.
A second long was taken.
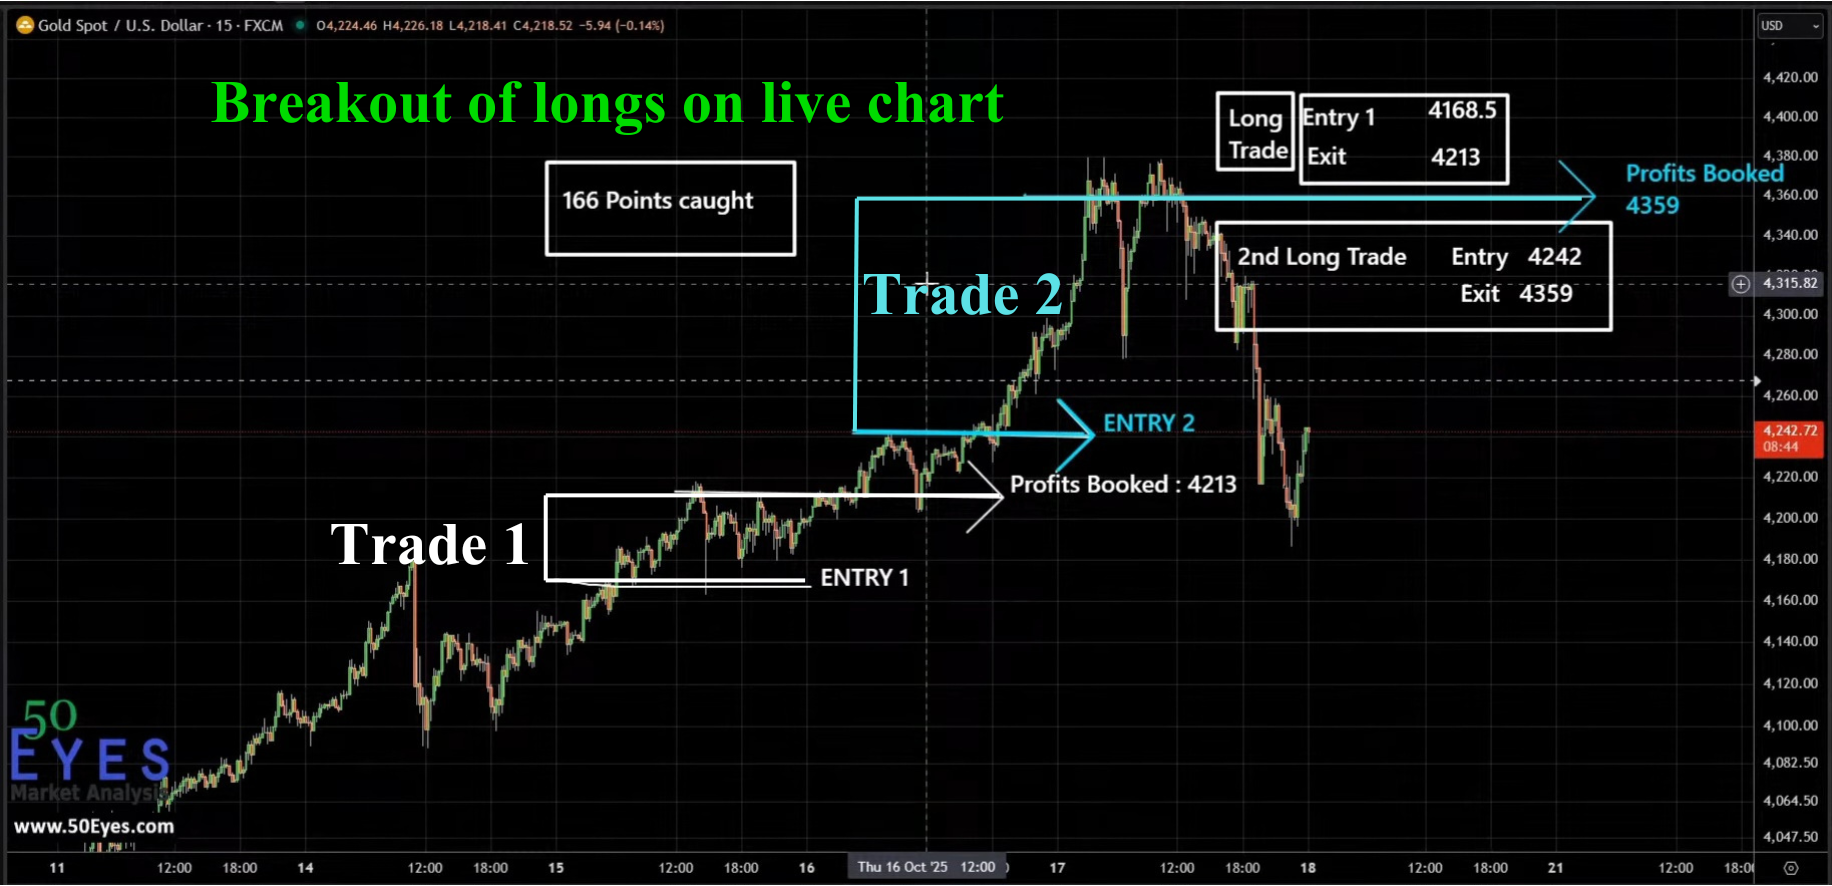
GOLD long setup capturing 166 points illustrattion on chart
Entry 2: 4242
Exit 2: 4359
≈ 116 points captured
This move was stronger, cleaner, and extended into wave expansion territory.
The exit near 4359 aligned with structural exhaustion levels — not emotional decision-making.
Why This Gold Trading Setup Worked
Many traders chase momentum.
Professional market trading aligns with structure.
Here’s what made this week different:
- 1️⃣ Bias was defined before the move.
- 2️⃣ Entry was based on trigger confirmation.
- 3️⃣ Risk was controlled from the start.
- 4️⃣ Profits were protected.
- 5️⃣ Continuation was traded — not feared.
This is where Elliott Wave forecasting becomes powerful.
It doesn’t predict random candles.
It identifies where expansion probability increases.
When structure and execution align, volatility becomes opportunity.
From Forecasting to Measurable Outcome
This case study demonstrates a complete trading cycle:
Forecast → Live Discussion → Position Management → Documented Exit
Most gold trading content online shows only one part.
Either analysis…
Or result.
Rarely both connected.
This page connects:
- Webinar-based forecasting
- Slack-based execution
- Chart-based verification
That transparency is intentional.
What Serious Traders Should Take From This
Gold trading success is not about catching every move.
It is about:
- Aligning with larger cycle direction
- Managing risk precisely
- Letting impulse waves develop
- Protecting profits before reversals
In this example:
Two trades.
One structured bullish bias.
166 points captured.
That’s disciplined market forecasting applied in real conditions.
Final Reflection
Markets reward preparation more than prediction.
When analysis is done using structured Elliott Wave principles, and execution follows defined risk management rules, forecasting becomes more than theory.
It becomes measurable.
This 166-point gold move is not presented as hype.
It is presented as documented execution aligned with structured market forecasting.
And this is just one chapter within a much larger body of market research and trading case studies.
Related Market Case Studies
Explore additional Gold studies and related market analysis:
Gold 12-Week Forecast Consistency Study
Consistent forecasting performance tracked across a structured 12-week period.
Gold Multi-Year Forecast (2017–2021)
Long-term gold forecast capturing a complete multi-year market cycle.