Do Market Forecasts Really Work?
Let’s start with an honest question.
Do forecasts actually work?
Or are they just lucky guesses that people later adjust?
Most people believe markets cannot be predicted.
“Gold goes up and down randomly,” they say.
“Anything can happen.”
Fair point.
But what if we showed you a forecast made in February 2017…
And then showed you what happened in 2020–2021?
Not hindsight.
Not edited charts.
Not revised analysis.
A real, time-stamped projection.
Let’s walk through it together.
Step 1: Back to February 2017
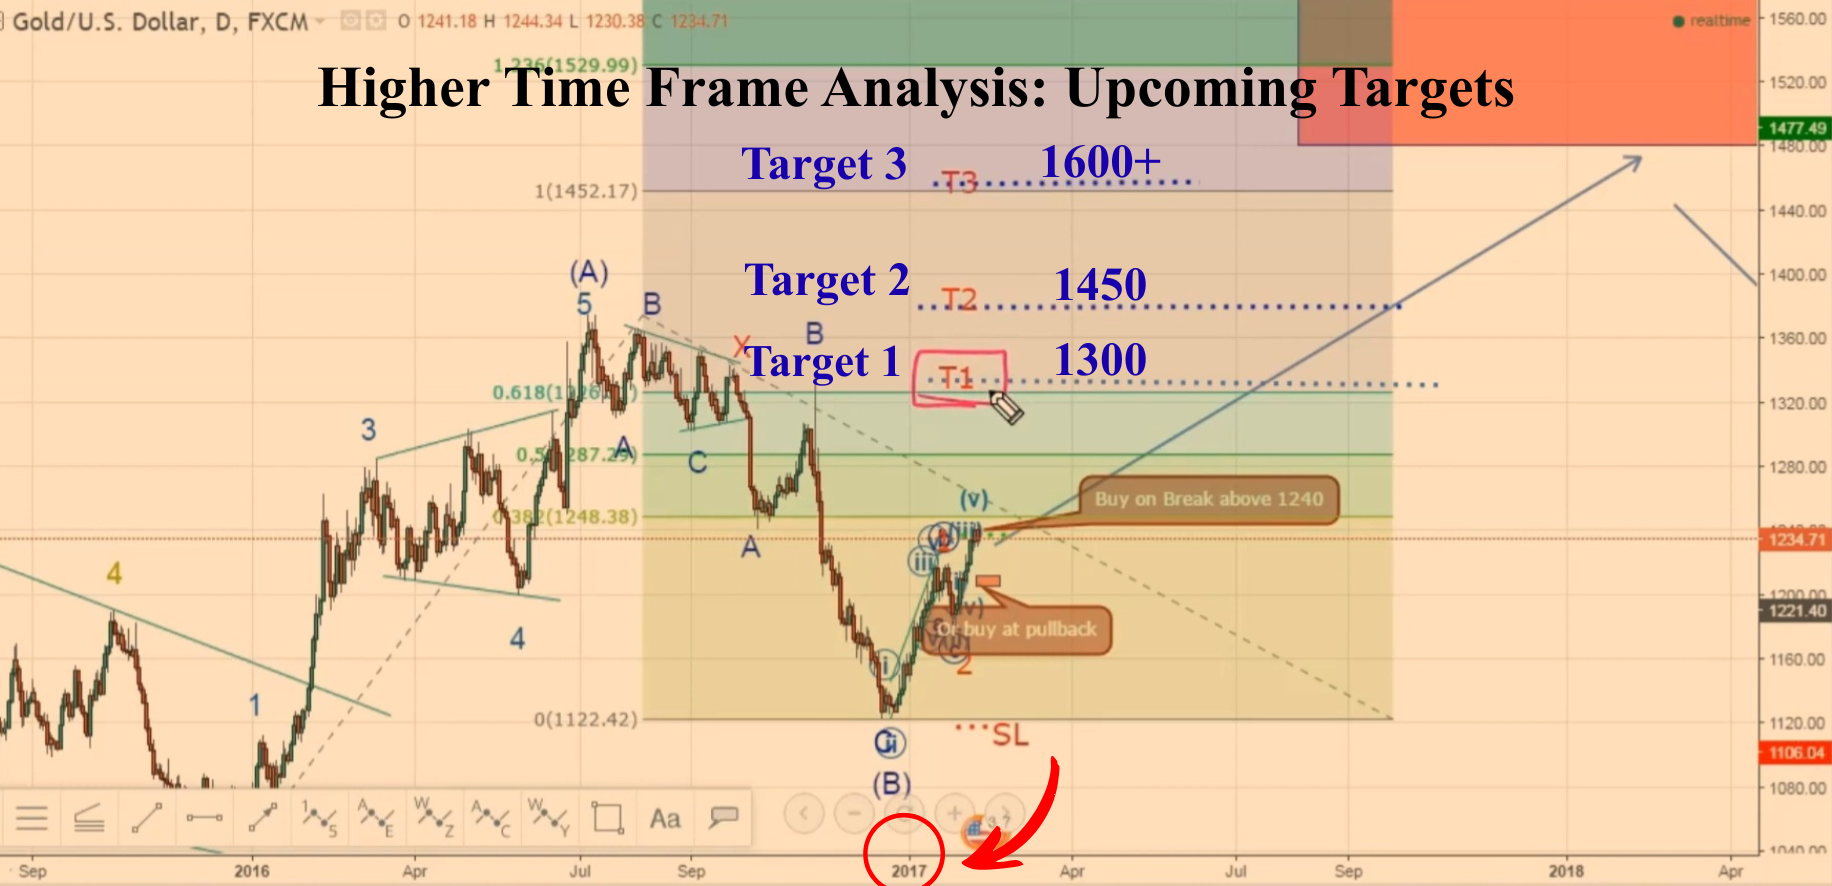
Gold upside targets from multi year analysis done in 2017
Imagine we are in early 2017.
Gold (XAUUSD) is trading much lower than 1300.
The mood in the market is uncertain.
In one of our long-term lectures, we analyzed the larger structure of Gold using Elliott Wave principles.
🎥Video of the multi year analysis done in 2017 (Long term analysis)
We asked:
- Where is Gold in the bigger cycle?
- Is this just a bounce?
- Or is a larger move developing?
After analyzing multiple possible scenarios, something very important became clear:
👉 Every major scenario was pointing upward.
Not sideways.
Not crashing.
Upward.
So we projected long-term upside targets:
- Around 1300
- Around 1450
- Around 1600+
- Possibly even higher over time
This was not a short-term trade call.
This was a structural, multi-year roadmap.
Now the real question…
Did it work?
Step 2: Fast Forward to 2020
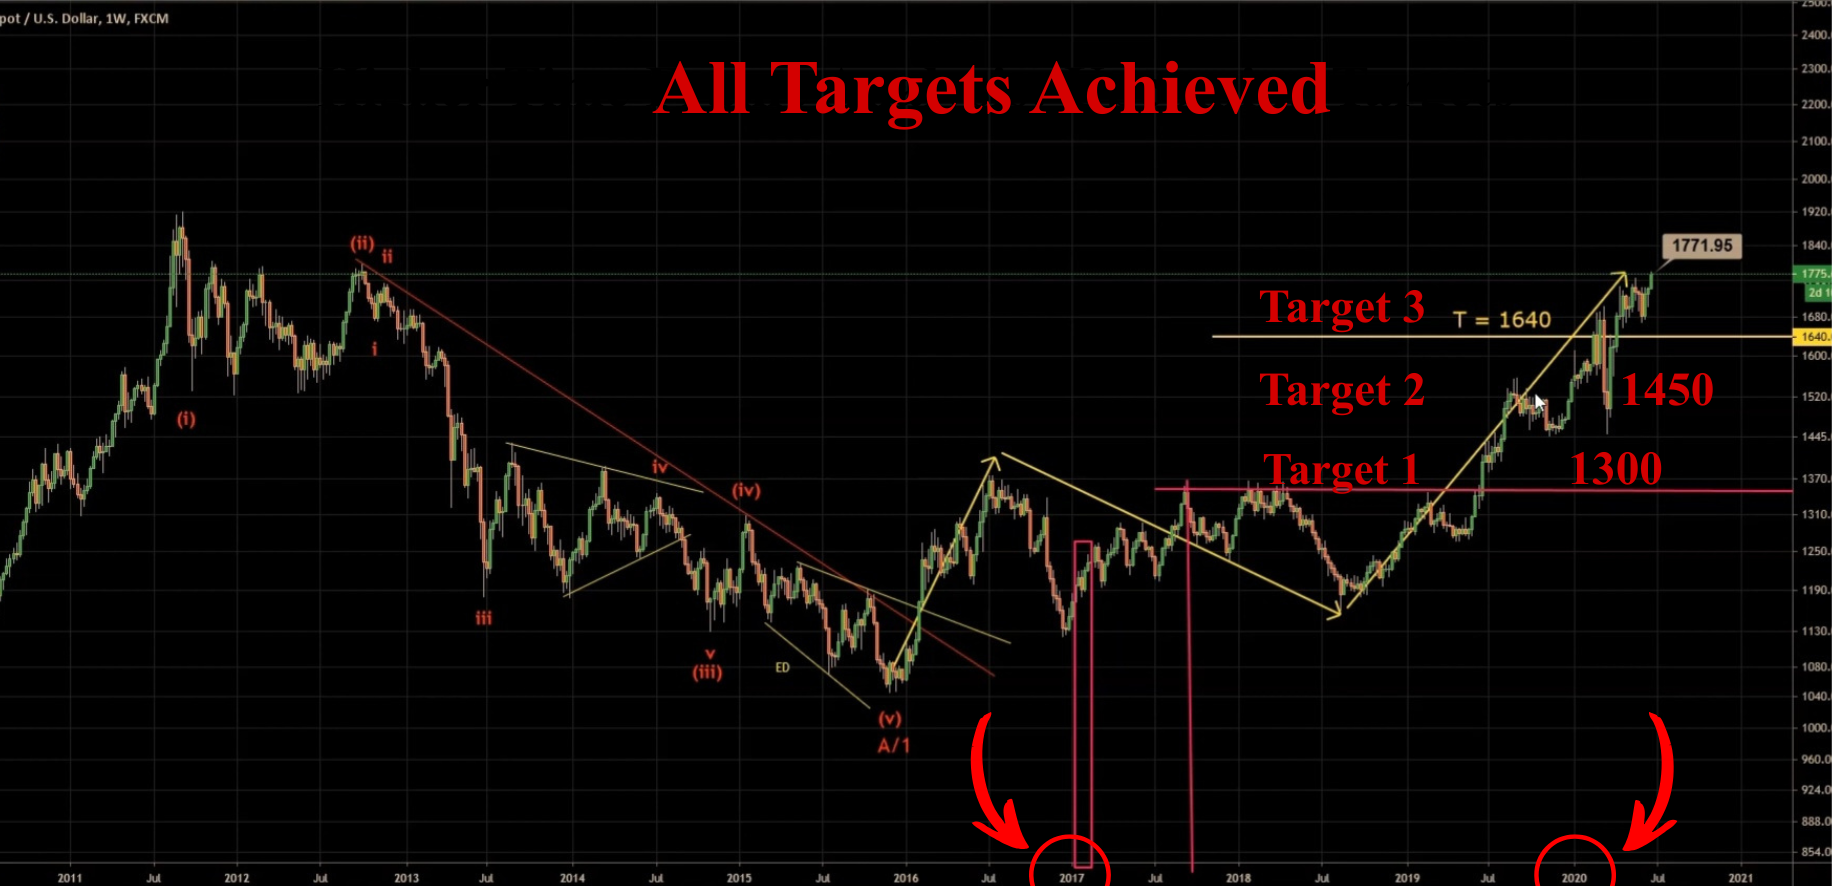
GOLD all targets achieved in 2020 (1600 plus points move caught)
Let’s now jump more than three years ahead.
It’s June 24, 2020.
What did the market actually do?
🎥Video showing how the multi year targets played out
Here’s what happened:
- ✔ 1300 was achieved within 2017.
- ✔ 1450 was reached later — just as projected.
- ✔ 1600+ was achieved by 2020.
- ✔ Gold continued its bullish expansion into 2020–2021.
The structure we projected in 2017 didn’t just work for weeks.
It unfolded for 3+ years.
That’s not luck.
That’s structure.
So… Can Markets Really Be Forecasted?
Here’s the honest answer:
Not with 100% certainty.
But yes — with high probability — when you understand structure.
Markets are not random noise.
They move in cycles.
They expand and correct.
They follow crowd psychology.
When we analyzed Gold in 2017, we were not guessing price.
We were reading structure.
And structure doesn’t change just because headlines change.
That’s why the forecast stayed valid for years.
Final Thought
In February 2017, we projected higher targets for Gold.
By 2020–2021, the market confirmed those targets.
The timestamps confirm it.
The charts confirm it.
The market confirmed it.
So next time someone asks:
“Do forecasts really work?”
You can say:
Yes — when they are based on structure, not emotion.
Related Market Case Studies
Explore additional Gold studies and related market analysis:
Gold 166 Points One Week Trade
Short-term execution capturing a high-momentum move within a single week.
Gold 12-Week Forecast Consistency Study
Consistent forecasting performance tracked across a structured 12-week period.