Sometimes the market doesn’t need a dramatic breakout to create opportunity.
Sometimes the real edge comes from recognizing where the market is unlikely to fall.
So the key question becomes:
👉 What happens when a strong support region holds… and the market refuses to break lower?
Does it simply stay sideways?
Or does it start building momentum for the next move upward?
This case study walks through a real S&P 500 forecast, where the focus was not on resistance or breakout levels, but on a support zone between 5405 and 5345.
At the time of the discussion during a public webinar, the market was trading near 5625, and the primary view was bullish.
The reasoning was simple:
👉 As long as the support region holds, the market structure favors a move higher.
What followed was a strong upward move, with the S&P 500 eventually reaching 5708, delivering more than 100 points of movement from the entry area and 80+ points captured on the trade.
Before we look at the result, let’s understand how the idea was formed in the first place.
For over 10 years, market analyst Neerav Yadav has been forecasting global financial markets using structured technical analysis.
Across multiple webinars and recorded discussions, these forecasts have maintained a documented accuracy of over 80%, providing transparency and trackable results.
👉 This S&P 500 example is another instance where market structure and support levels helped define a high-probability scenario.
The Market Situation During the Webinar
At the time of the analysis, the S&P 500 was trading around 5625.
The broader structure suggested that the market was leaning bullish, but there was one important level to watch.
The support region between 5405 and 5345.
This support area had not been fully tested, which meant the market could potentially move down to retest it before continuing upward.
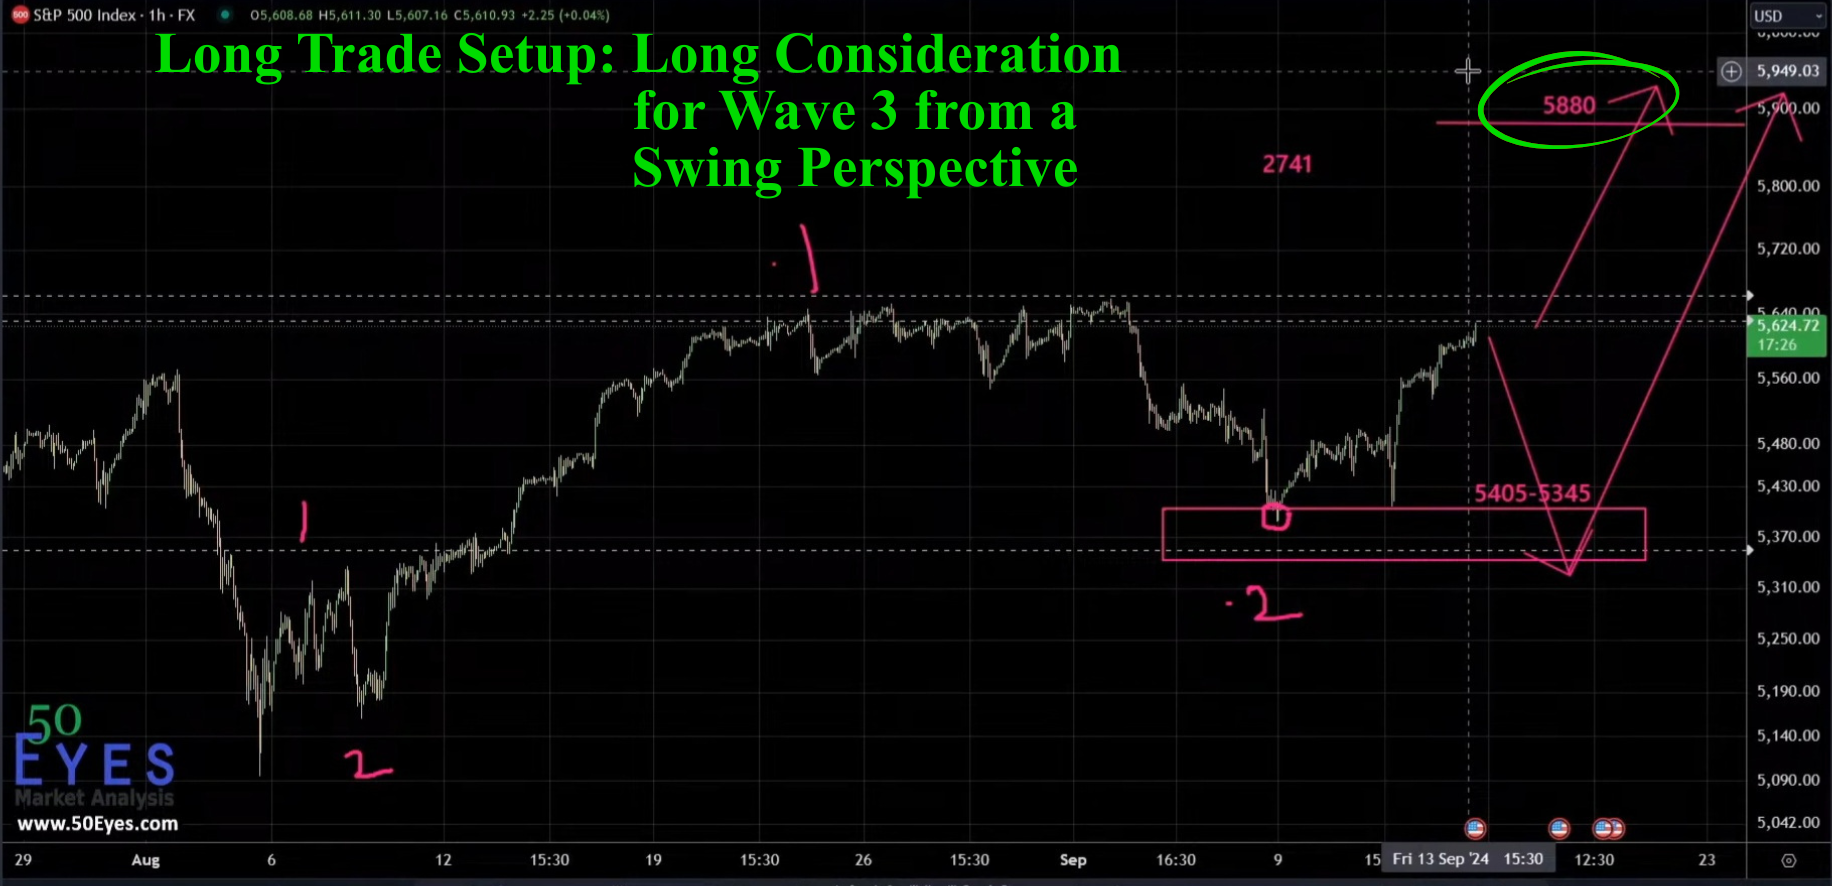
S&P 500 long trade setup for wave 3 from a swing perspective
So two scenarios were discussed:
- 1️⃣ Scenario 1 – Bullish Continuation
The market continues moving higher without deeply testing the support zone. - 2️⃣ Scenario 2 – Deeper Pullback
The market drops toward 5345, tests the support, and then resumes the bullish trend.
However, the second scenario was considered lower probability.
👉 The primary outlook remained bullish.
🎥 Video 1 – Market Outlook and Support Analysis
Understanding the Core Idea
The analysis focused on a simple principle of market behavior:
👉 Strong markets often refuse to fall to deeper support levels.
When price holds above support instead of testing it fully, it often signals underlying strength.
That was the key insight behind the bullish perspective.
But the real question remained:
Would the market respect the support region?
What Actually Happened on the Chart?
Markets eventually reveal whether the hypothesis was correct.
In this case, something interesting happened.
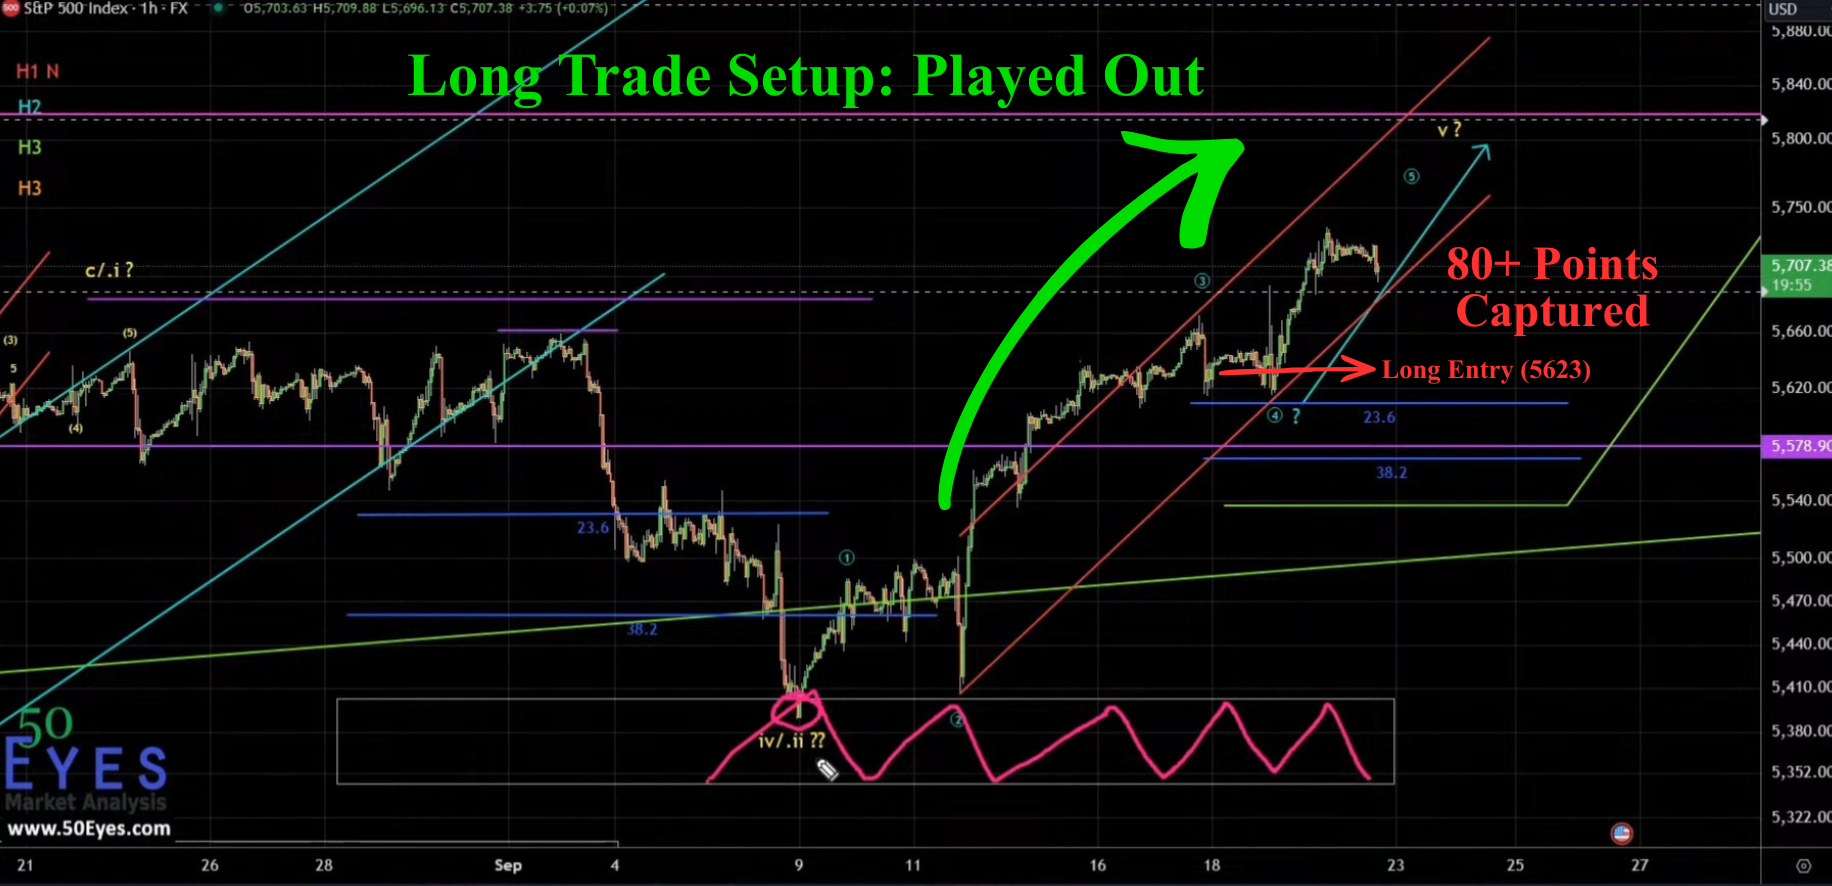
S&P 500 long trade setup played out precisely capturing 80 points
The market never fully tested the lower part of the support zone.
👉 Instead, price only interacted with the upper boundary of the support region and then started moving higher.
That was an early indication that the bullish scenario might be playing out.
🎥 Video 2 – Chart Result and Trade Management
During the webinar discussion, the price was near 5625.
Later, the market moved to approximately 5708.
Let’s look at the numbers.
- Original long entry: around 5623
- Recent price: around 5708
👉 This resulted in a total movement of approximately 106 points, with around 80+ points effectively captured on the trade.
Trade Management During the Move
One of the important aspects of professional trading is risk management.
During the move, the trailing stop loss was adjusted to 5684, which was above the original entry price.
👉 This meant the position was now protected in profit.
Additionally, short-term scalp trades were also taken during the week as the market continued showing strength.
The combination of the original long position and scalp trades allowed the move to be captured effectively.
What This Case Study Reveals About Market Behavior
This S&P 500 example highlights an important concept that many traders overlook.
👉 Sometimes the most important signal is not what the market does… but what it refuses to do.
In this case:
- The market did not fall to the lower support boundary
- It respected the upper support region
- Momentum gradually shifted upward
That behavior often indicates underlying buying strength.
Key Lessons from This S&P 500 Trade
- Support Zones Can Reveal Market Strength
When price holds above support rather than testing it fully, it often suggests buyers are active earlier than expected. - Multiple Scenarios Help Prepare for Market Moves
Discussing both bullish and bearish possibilities allows traders to stay flexible. - Trade Management Protects Profits
Adjusting trailing stops above entry ensures that profitable trades remain protected. - Documentation Builds Transparency
Recorded analysis and visible chart results allow viewers to evaluate forecasts objectively.
A Larger Perspective on Market Forecasting
Financial markets are complex systems influenced by countless factors.
However, by focusing on structure, key levels, and probability, traders can often identify scenarios where the odds are more favorable.
For over a decade, Neerav Yadav has been applying this analytical approach to global markets including:
- Stock indices like the S&P 500
- Commodities such as Gold and Crude Oil
- Major currency pairs like EUR/USD
Across these forecasts, the focus has always remained the same:
👉 Identify high-probability setups based on market structure, and allow the market itself to confirm the idea.
This S&P 500 trade, capturing 80+ points from the bullish setup, is one more example of how support levels and structured analysis can lead to meaningful opportunities.
Related Market Forecast Case Studies
You may also explore these documented forecasts:
- S&P 500 Short Trade Case Study (140+ Points Captured)
- SPX500 Breakout Case Study (6030 to 6270 Rally)
- Gold Market Forecast Case Study
- EUR/USD Market Forecast Case Study
These examples show how the same analytical framework can be applied across multiple financial markets.