In this report I will be discussing in detail the Elliott Wave counts for S&P 500 from the Daily down to the 15 minute chart to see the possible progression of this market from long term to short term and see if the possible targets in accordance with this count.
Please note that the same has been discussed the attached video report in even more detailed manner.
Daily Chart :
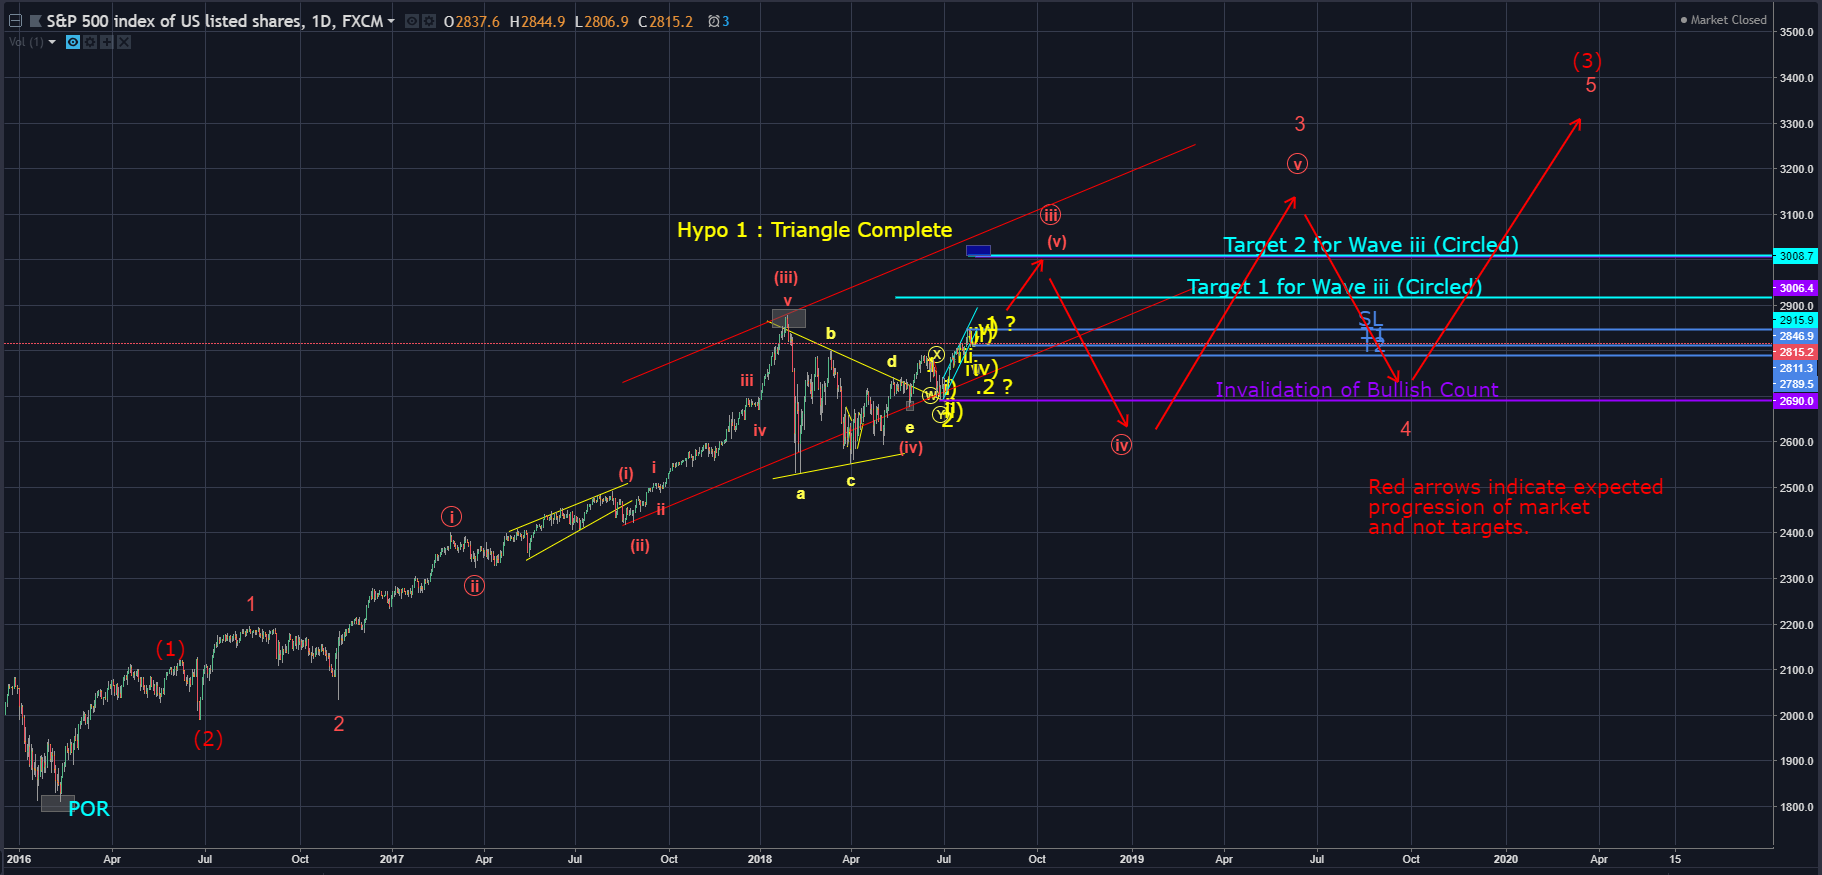
On the daily chart we start our count from the bottom left rectangle labelled as POR (Point of Reference), from here we see that the market is currently in an Impulsive 5 wave move with the current price action in Wave iii (Circled) of Wave 3 of Wave (3).
This basically suggests that we should see a minimum of three more legs to the upside before Wave (3) gets completed.
Using standard Fibonacci extension to measure Wave i (circled) and projecting the same from Wave ii (circled) low gives the 161.8 level near 2916 which is also marked as the Target 1 level as it is the minimum expected target for this the upside in case this count is the one being followed by the market.
4 Hour Chart :
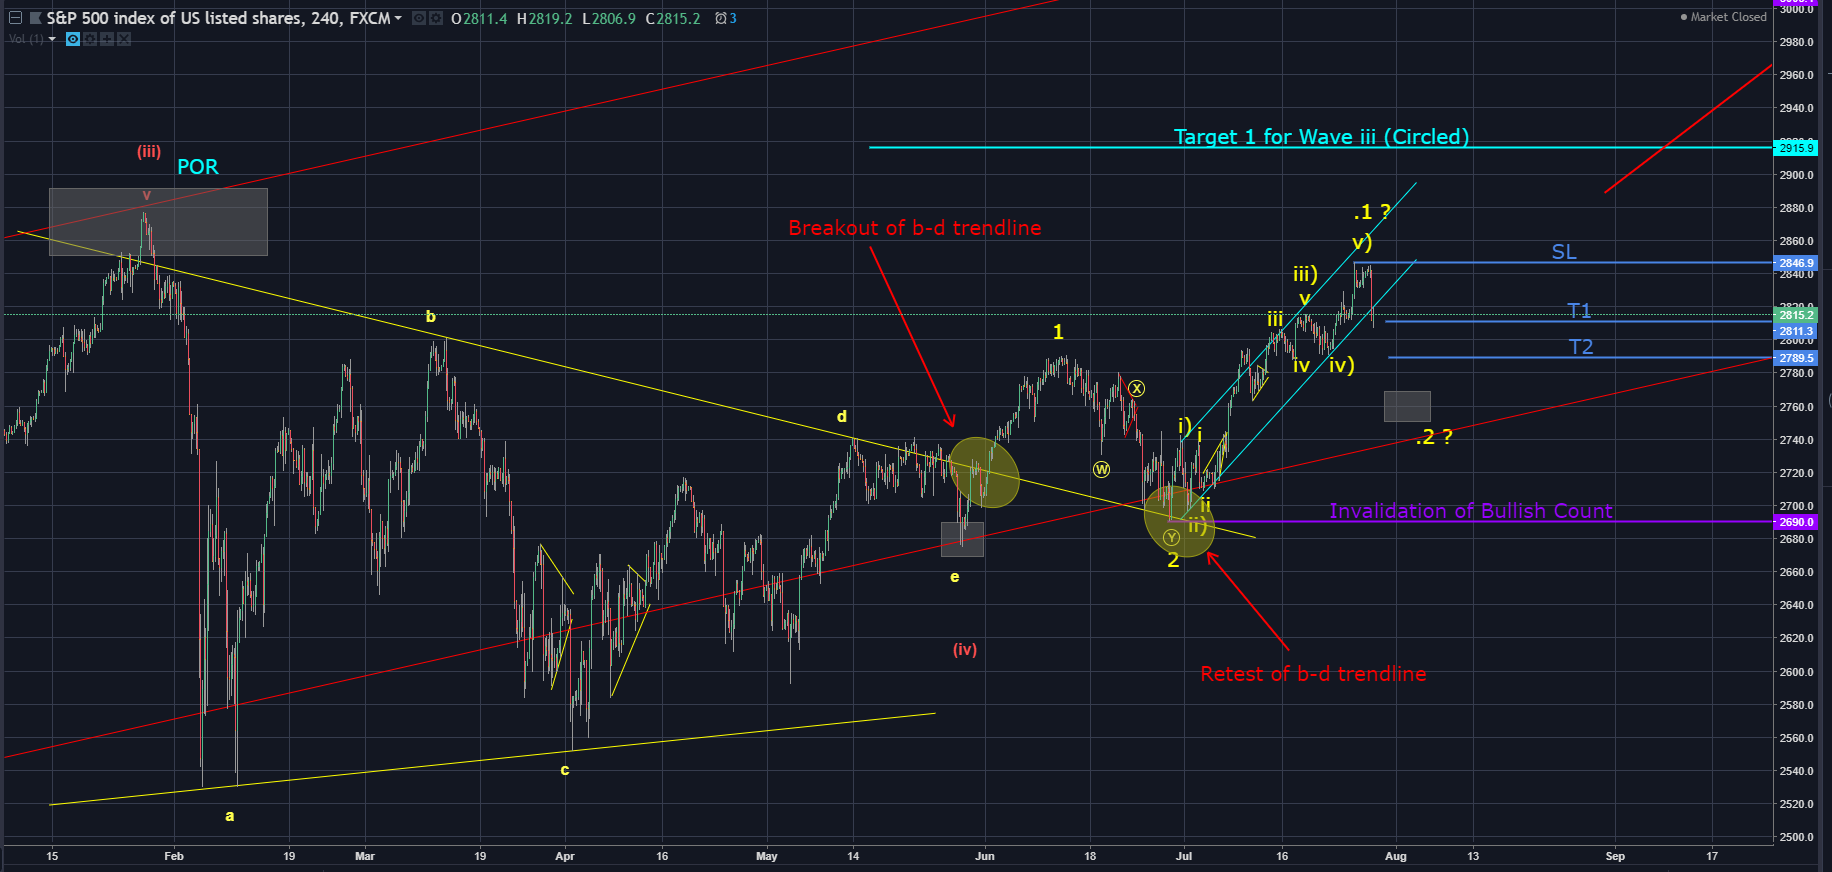
Now that we have discussed the bigger picture we will take a look at the curent progression after the Triangel Wave (iv) for doing the same we will take POR (Point of Reference) as the the Wave (iii) high.
The reason for going with this bullish count as of now is the clear triangle pattern visible in Wave (iv), in specific the b-d trendline of this Wave (iv) Triangle first is breached to the upside and then price comes to test the same and reverses to the upside which gives strength to this pattern and in terms this count.
Invalidation Level : If we see a move straight down the Invalidation Line marked at 2690 then we will have to consider bearish Elliott Wave counts for this market.
A rough out look for the bearish count is discussed in the attached video.
1 hour Chart :
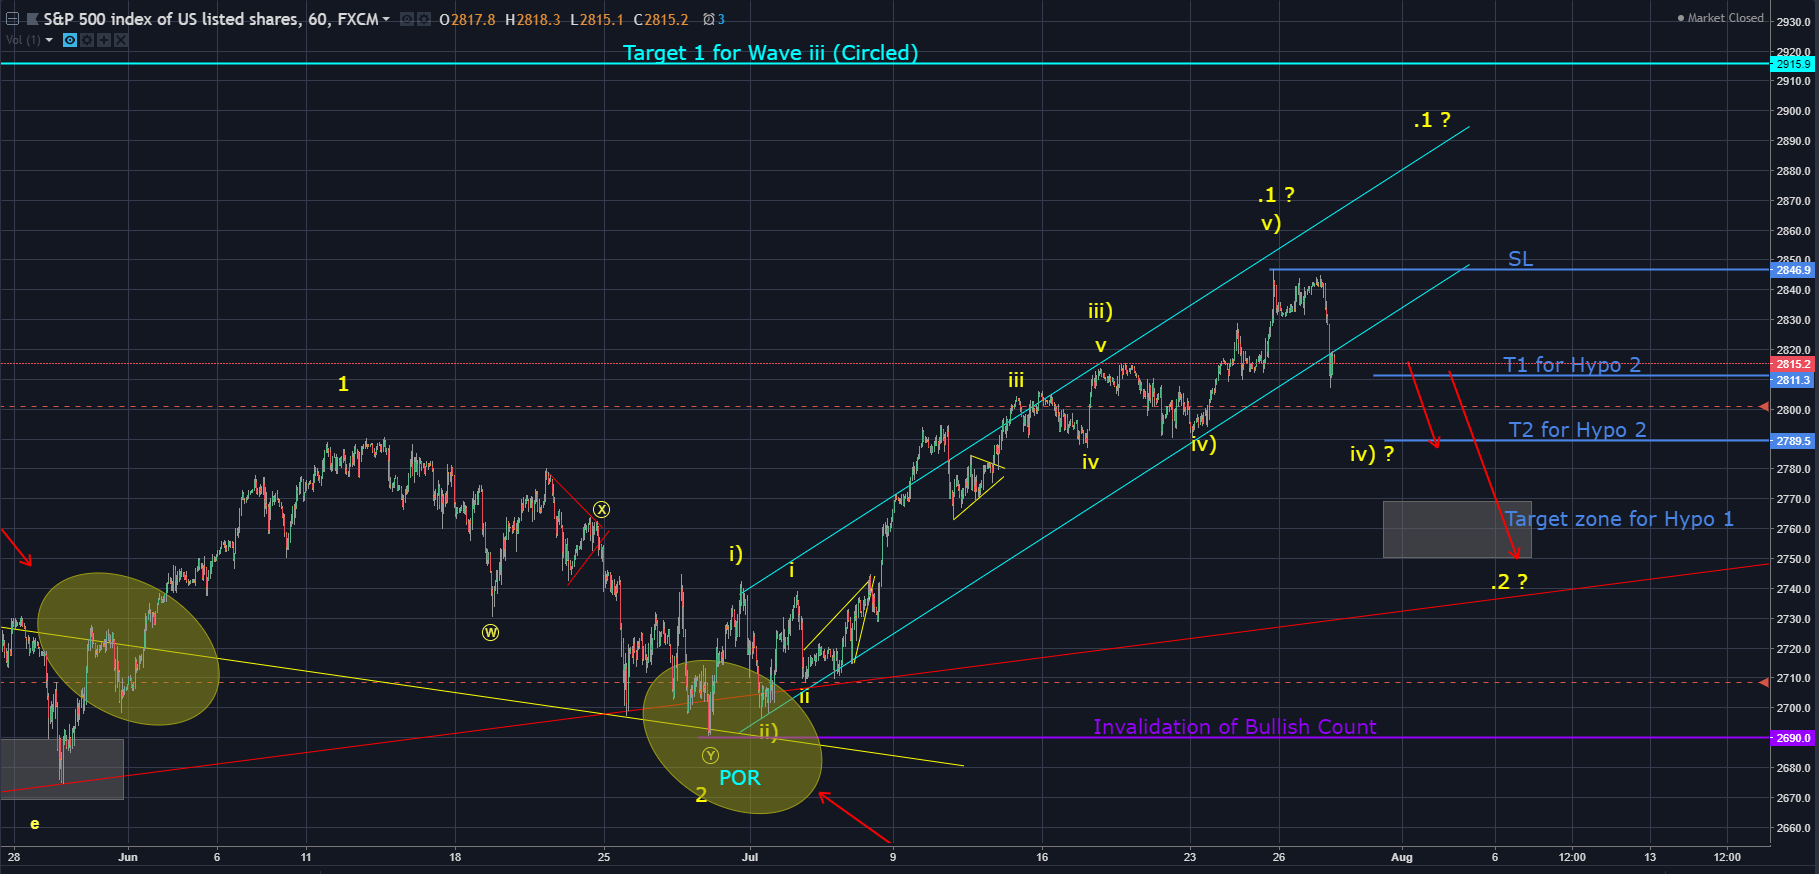
Now that we have established the bias for this count let’s look at the last leg up by moving the POR to the Wave 2 low to get an outlook for the upcoming sessions.
From this point onwards we see a Impulsive move to the upside which is either complete as market by Wave .1 at the top or is still continuing by progressing in Wave iv) of Wave .1, we will refer the probability of Wave .1 already complete as Hypo 1 and Wave iv) under progression as Hypo 2.
In either cases we see that the bias for the short term perspective is to the downside as if we go with Hypo 1 we will see a Wave .2 to the downside which should ideally take prices to the white support zone of 2770 to 2750, whereas if we go with Hypo 2 then we expect Wave iv) to complete near 2789 price level.
Whichever Hypo plays out in this market from a short term perspective we expect a move down atleast till the 2789 level as that level is common in both our Hypos.
Will update further as this market progresses.
Details regarding one to one training : Click Here
Get 1 month free entry to the private group and learn to trade using Elliott Wave Principles – My Video Course
To receive these updates at the earliest you can subscribe to my Emailing List.
Disclaimer – All content presented here is strictly for educational purpose, do read the complete site disclaimer before taking any action.


