Neerav Yadav


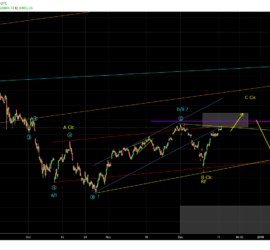
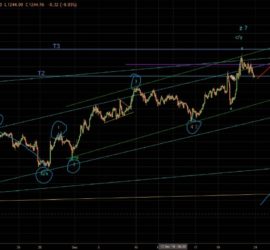
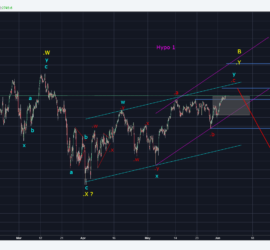
Nifty expecting bearish to sideways movement (Elliott Wave Analysis) 12th December 2018 onwards

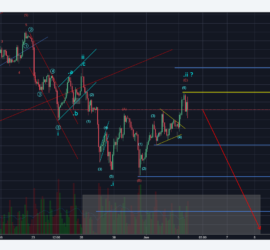
In the last video update which was published on October 7th, the view for Nifty was bearish (minimum two legs down) with a downside T1 of 10065 which has already been achieved and the market formed a intermediate low near 10000 level. Last Video Report As of now there seems […]

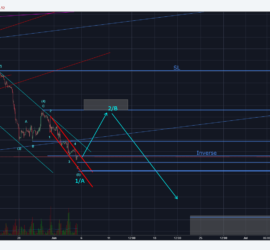
Nifty Hourly (Hypo 1) 12th December 2018 onwards

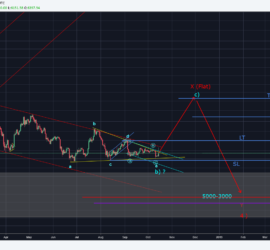
[Detailed Analysis + Video Report] Bitcoin Trade Setup (Elliott Wave) 15th October 2018 onwards

For a detailed outlook and trading strategy check the below video report.    As per the daily chart of Bitcoin (BTC/USD) below,it seems that BTC has completed a Triangle formation (As per Elliott Wave Terminology).     The Triangle seems to be in Wave b) of Wave X which seems […]

Bitcoin Daily Chart (15th October 2018) Elliott Wave Count

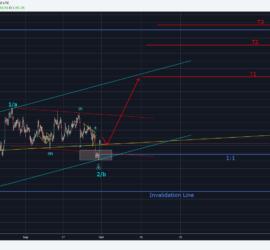
[Detailed Analysis + Video Report] Gold possible low risk long opportunity (Elliott Wave) 1-10-2018 onwards

In the last video update posted above the Elliott Wave analysis suggested two probabilities, both were pointing in the upward direction form a swing perspective for Gold (XAU/USD) however there was no clear entry signal.   In the Hourly chart posted above there are some strong indications that this market […]

Gold Hourly chart Elliott Wave Count , suggesting upside (1-10-2018 onwards)

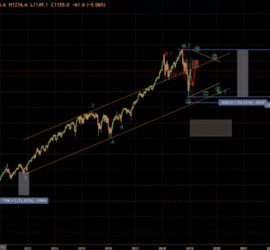
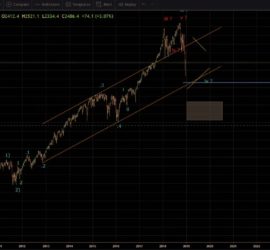
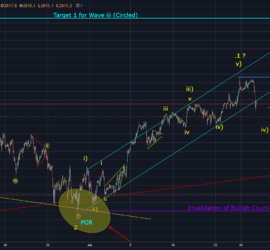
[Detailed Analysis + Video Report] SPX looks to be moving down in a corrective decline (30th July, 2018 onwards)

In this report I will be discussing in detail the Elliott Wave counts for S&P 500 from the Daily down to the 15 minute chart to see the possible progression of this market from long term to short term and see if the possible targets in accordance with this count. […]

SPX 1 Hour chart, Elliott Wave Count, 29th july 2018 onwards

Video Report : Gold Long Trading Opportunity (Detailed Elliott Wave Analysis) Targets 23rd May, 2018 onwards

In this video Report I have done a detailed Elliott Wave Analysis of Gold (XAU/USD), discussing the current double Zig Zag correction to the upside which seems to be now in Wave C of the second Zig Zag. If this analysis plays out as expected then we can see upside […]

Gold Daily chart 23rd May, 2018 with Double Zig Zag correction to upside and Stop Loss below Wave x low

Nifty possibly forming an Ending Diagonal (Elliott Wave Analysis) 2nd April 2018 onwards

In the last video analysis posted on 31 March, 2018 I discussed three possible scenarios with respect to Elliott Wave for Nifty (Index of Indian stock market), however there was a possibility that I didn’t discuss for the same I’m writing this article. This case of the Ending Diagonal suggesting […]

SGX Nifty possible Ending Diagonal

Video Report : Nifty Detailed Elliott Wave Analysis 31st March 2018 onwards + One to One classes now available

In this video I have discussed three possible Elliott Wave scenarios for Nifty 50 (Index of Indian Stock Market). Hypo 1 suggests the most bearish and least probable scenario of continuation of Wave C of the Zig Zag to the downside. Hypo 2 discusses all three upside possibilities of Triangle, […]

NIfty Elliott Wave Analysis and forecast 19th March 2018 onwards